
Trading articles/The Art and Science of Position Sizing: Lessons from Van Tharp and Tom Basso
Oct 27, 2025 · Momentum Trading Strategy
The Art and Science of Position Sizing: Lessons from Van Tharp and Tom Basso
Why the size of your trade, not your entry, determines your survival.
Originally published on Substack.
Position sizing is one of the most important, and least understood, elements of trading and investing. Most traders focus on finding the perfect entry, timing the market, or optimizing indicators. Yet it’s not the setup that determines your long-term success, it’s how much you risk when you take it.
The great trading mentors Dr. Van Tharp and Tom Basso both reached the same conclusion: you can’t control the market, but you can control your exposure to it. Position sizing is how you do that.
Why Position Sizing Matters
Every trader knows what it feels like to have a great idea that goes wrong. The market moves against you, your stop gets hit, and suddenly a single loss dents your confidence or your entire portfolio.
That’s not because the system failed. It’s because the position size was wrong.
Position sizing is the bridge between your strategy and your results. It’s the mechanism that translates a trade idea into a controlled level of financial risk. Without it, even the best system is just gambling.
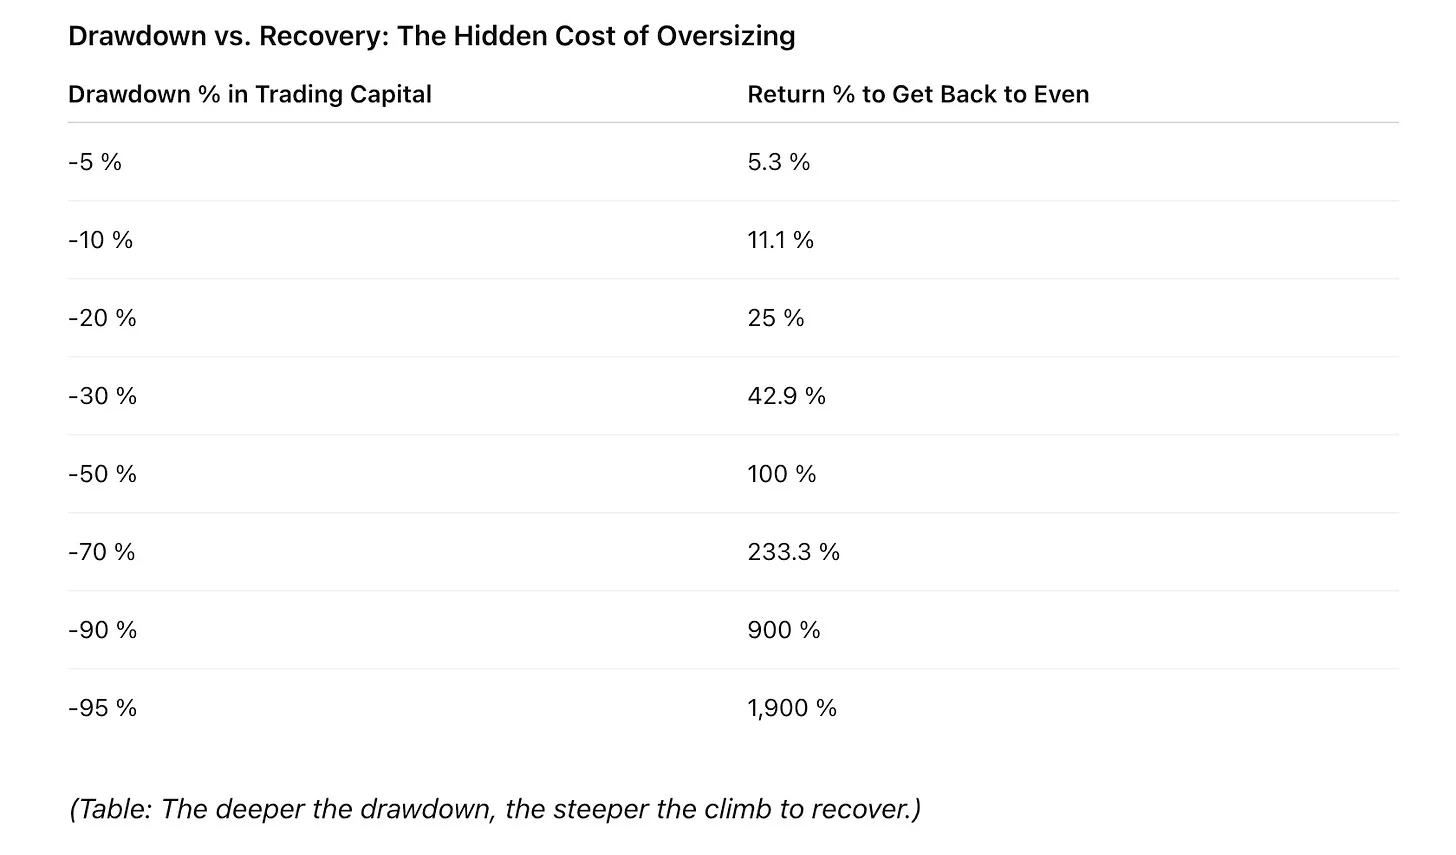
Large position sizes don’t just increase risk, they magnify drawdowns. And drawdowns are exponentially harder to recover from. Losing 10% of your capital requires an 11% gain to get back to even. But lose 50%, and you need 100% just to recover.
Knowing Your System: The Foundation of Sizing
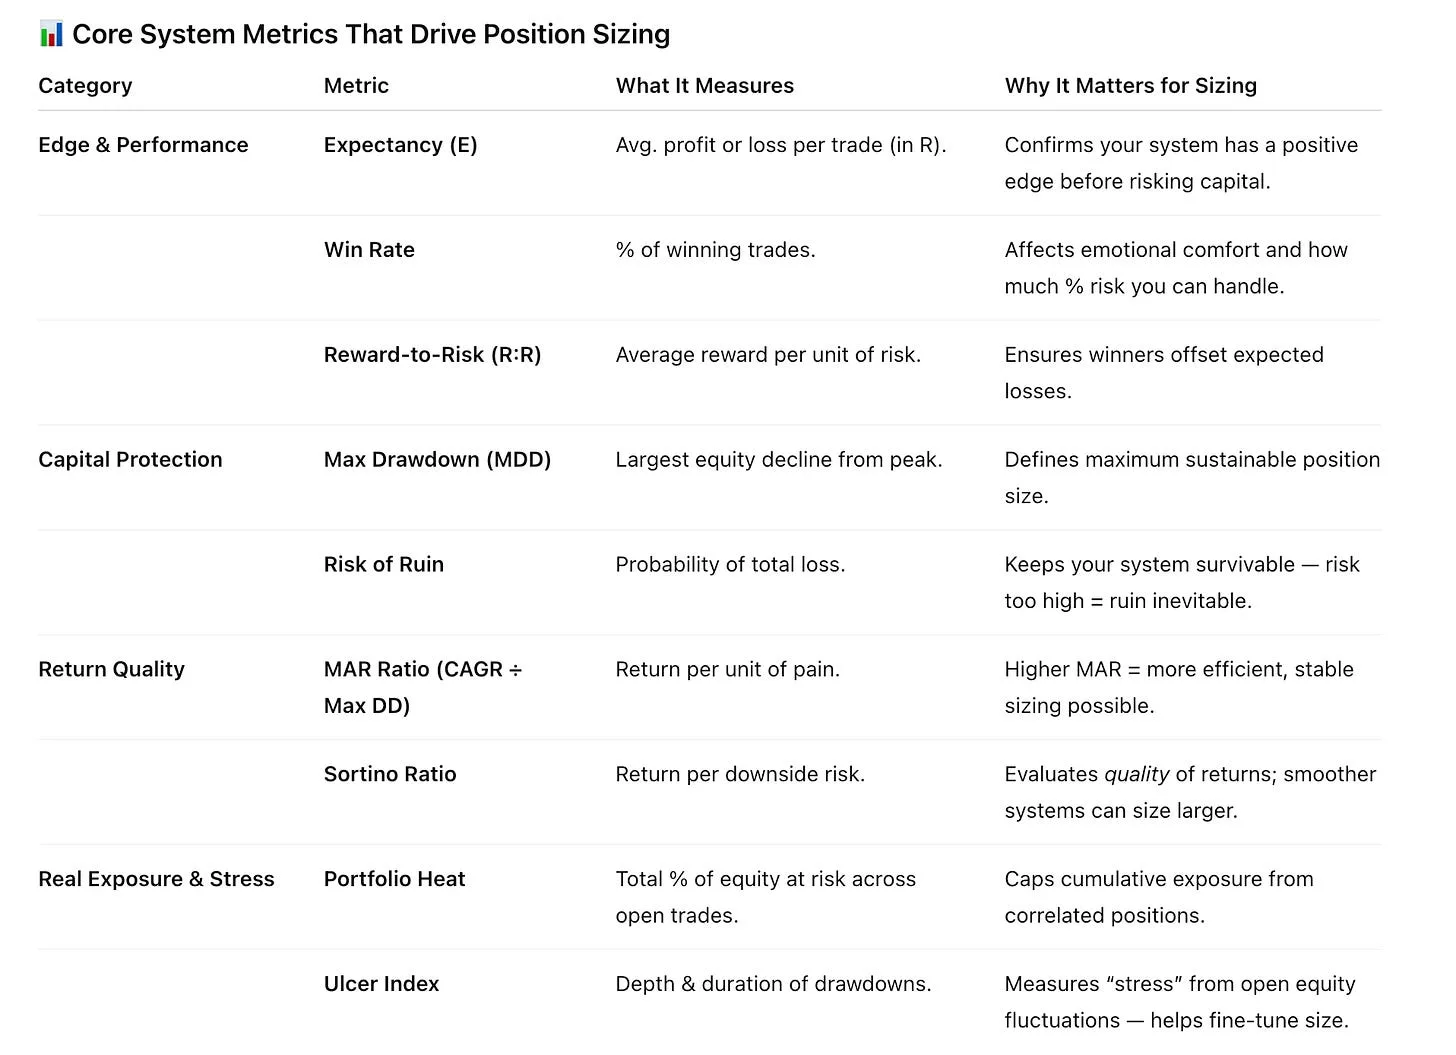
Before you can size positions intelligently, you need to understand your system’s mathematical profile. Position sizing doesn’t create profitability — it amplifies it or protects it. If your system has negative expectancy, perfect sizing will only make you lose money more slowly.
Professionals like Dr. Van Tharp and Tom Basso begin here — not with formulas, but with metrics that quantify the edge.
In Practice:
- Systems with a high MAR, positive expectancy, and low drawdown volatility can justify more dynamic sizing (e.g., ATR- or volatility-based).
- Systems with unstable metrics or small edges should start with fixed fractional or micro sizing.
- Always keep portfolio heat < 6% and risk of ruin < 1%.
- Track results over at least 100 trades before increasing risk per trade.
In short:
Your system defines your edge.
Your metrics define your confidence.
Your position sizing defines your survival.
The Core Principles
Risk Per Trade (The Van Tharp Model)
Dr. Van Tharp revolutionized the concept of risk control by defining the R-multiple, a standardized measure of risk and reward on each trade.
- R = the initial risk per trade (the amount you stand to lose if the stop is hit).
- R-multiple = the outcome of a trade expressed as a multiple of that initial risk.
- A loss that hits your stop = –1R
- A win that makes twice your risk = +2R
If your trading capital is $100,000 and you risk 1% per trade, your 1R = $1,000.
No single trade should ever risk more than 1R.
Formula:
Position Size = Risk per Trade ÷ Dollar Distance to Stop
This means your stop determines how large you can trade, not your conviction level. If your stop is further away, you reduce size to keep your loss constant.
Example:
- Portfolio: $100,000
- Stop: 30% below entry
- Risk: 1% = $1,000
- Position Size = $1,000 ÷ 0.30 = $3,333
Even though the stop is wide, your loss remains 1% of capital. That’s the essence of professional risk management.
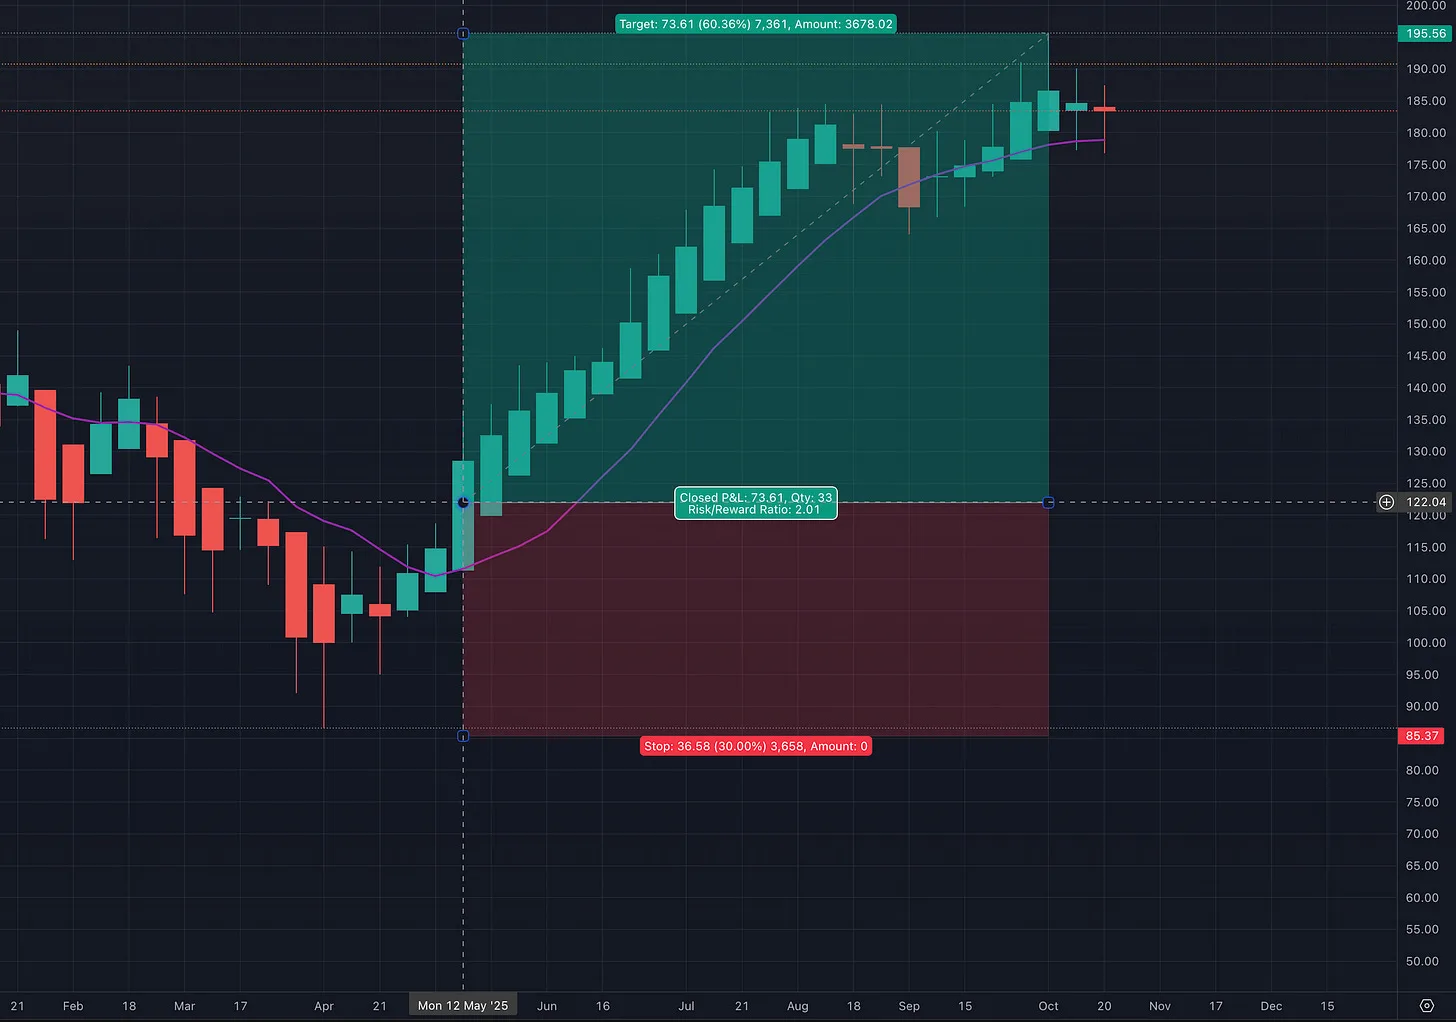
Example: Measuring R-Multiples and Adjusting Position Size
In this trade setup, the stop-loss is 30% below entry, defining 1R of risk. Even though the stop is wide, the position size is reduced so that the total dollar risk remains constant at 1% of the portfolio.
The target is placed at twice the risk distance, creating a +2R result (a 2:1 reward-to-risk ratio). This visual shows how a wider stop doesn’t increase overall risk—position sizing keeps it controlled.
Volatility-Based Sizing (Tom Basso’s Approach)
Tom Basso, often called Mr. Serenity, emphasized that volatility affects not just your returns but also your emotions. A highly volatile position might technically fit your risk limits yet still cause sleepless nights.
To manage this, Basso uses the Average True Range (ATR) to adjust position size based on how much the market typically moves.
Position Size (Volatility) = ( $ Value of Equity in the account × % of the portfolio’s volatility allocated to this single position ) ÷ $ Value of the ATR on the instrument in the new trade
If the ATR expands, position size shrinks. When volatility compresses, you can take slightly larger size, all while keeping portfolio risk constant.
This approach smooths your equity curve and helps maintain emotional balance through market fluctuations.
Example: Calculating Position Size Using Volatility
To keep things simple, Basso used a 0.75% volatility allocation for each position. Here’s how he illustrated it:
Stock Example:
- Equity = $100,000
- Percent volatility allocation = 0.75%
- Volatility (ATR(21)) of XYZ stock = $0.85
- Position Size by Volatility = ($100,000 × 0.75%) ÷ $0.85 = 882.35 shares, rounded down to 882 shares
Futures Example:
- Equity = $100,000
- Percent volatility allocation = 0.75%
- Volatility (ATR(21)) of Gold futures = $3.60
- Volatility in dollar terms = $3.60 × $100 per point = $360
- Position Size by Volatility = ($100,000 × 0.75%) ÷ $360 = 2.08 contracts, rounded down to 2 contracts
These examples show how volatility-based position sizing keeps portfolio exposure steady across different markets.
Each trade contributes roughly the same amount of volatility to your total portfolio risk.
Basso’s simulations later confirmed that this approach works best when risk and volatility allocations are modest and consistent.
His tests found that allocating around 0.5–0.75% per trade produced the best long-term results with the smallest drawdowns.
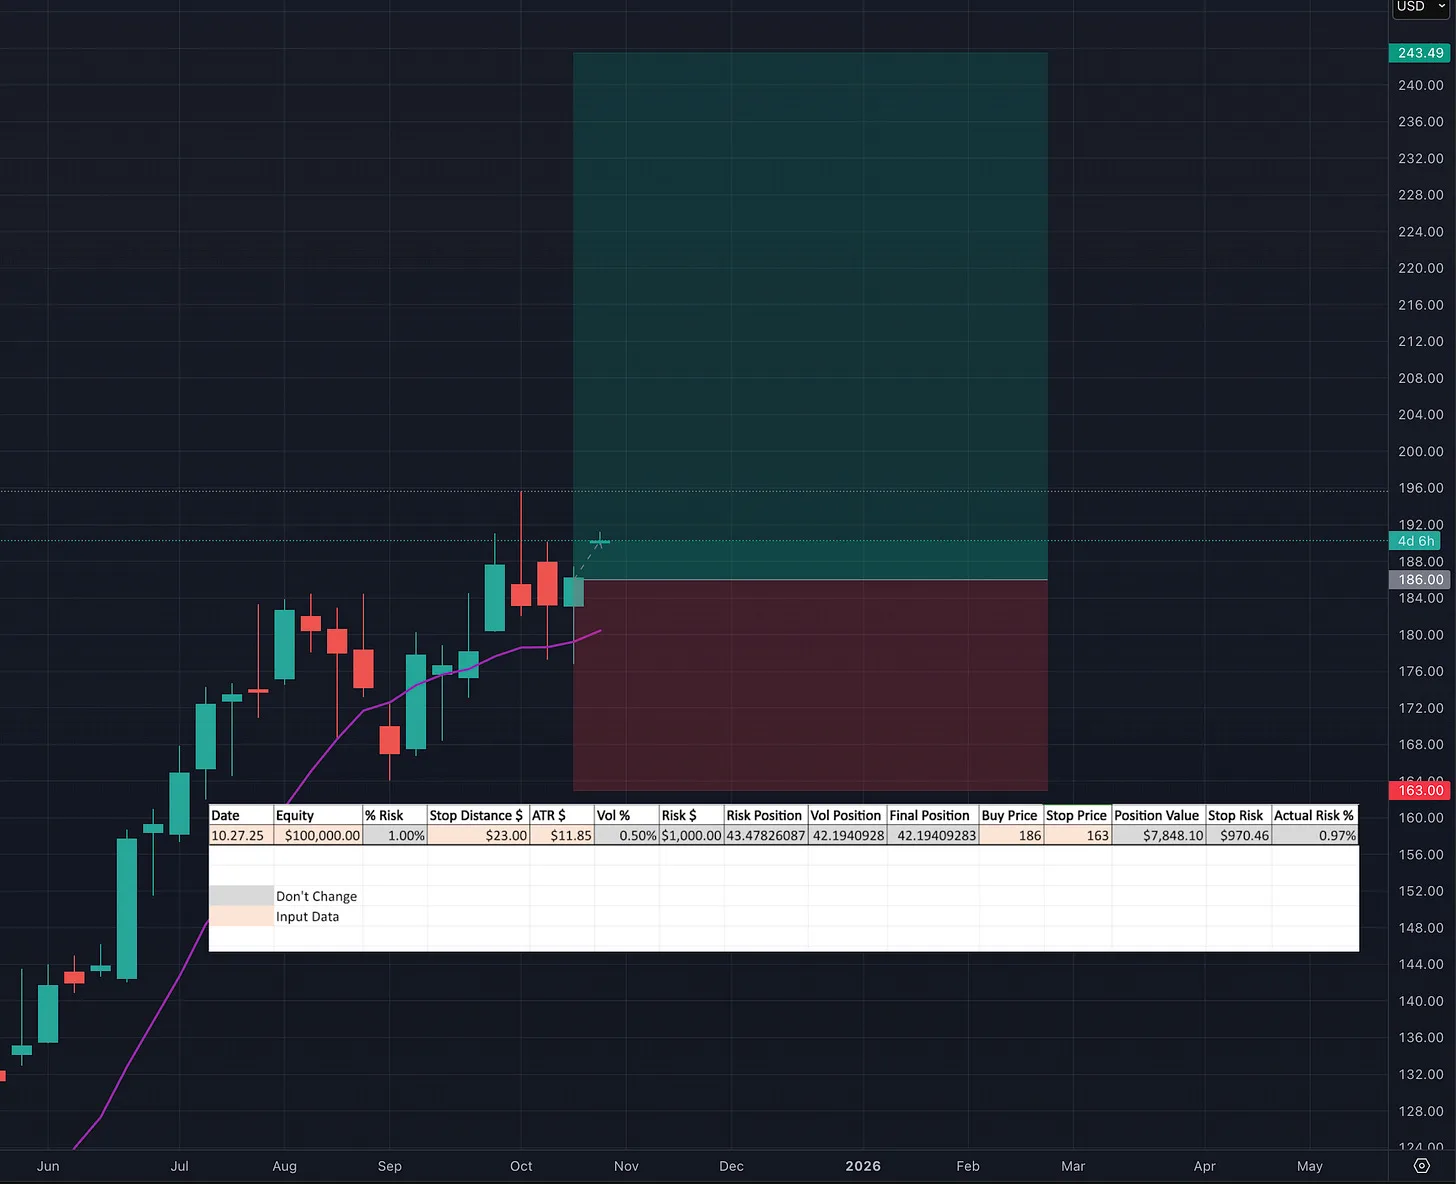
Example: Volatility-Based Position Sizing in Practice
This example uses an ATR of $11.85 and a 0.5% volatility allocation to size a position in NVDA. The result is a 42-share position — smaller than the 1% risk-based position — ensuring consistent exposure despite market volatility. The wide stop (around $163) is offset by reduced size, keeping total portfolio risk at roughly 0.97%. Volatility increases or wider stops don’t increase total risk — position sizing keeps it constant.
Margin and Capital Constraints
For leveraged traders in futures, forex, or options, margin itself becomes a natural limiter of risk. Basso suggests applying the same logic here — set a maximum percentage of your account equity that you’ll commit as margin to any one position, for example 5%.
Even if your risk or volatility sizing formulas allow for a larger position, margin control ensures you never overextend your portfolio. It’s a structural safeguard that prevents leverage from compounding small misjudgments into large losses.
Example:
If your account equity is $100,000 and you set a 5% margin limit, the maximum capital allocated as margin to any single position would be $5,000.
Even if the risk and volatility formulas call for 10 contracts, if 10 contracts require $8,000 in margin, the position must be reduced to stay within your 5% rule.
This simple constraint prevents:
- Over-leveraging in highly margined instruments like futures or forex
- Cascading losses during fast-moving markets
- Margin calls that force premature liquidation
Basso viewed this as the third filter in a complete position sizing process:
“Run all three — risk, volatility, and margin — and take the smallest position.”
– Tom Basso
Together, these three constraints — risk, volatility, and margin — create a complete, self-regulating position sizing system that adapts to market conditions and protects the trader from both volatility and overexposure.
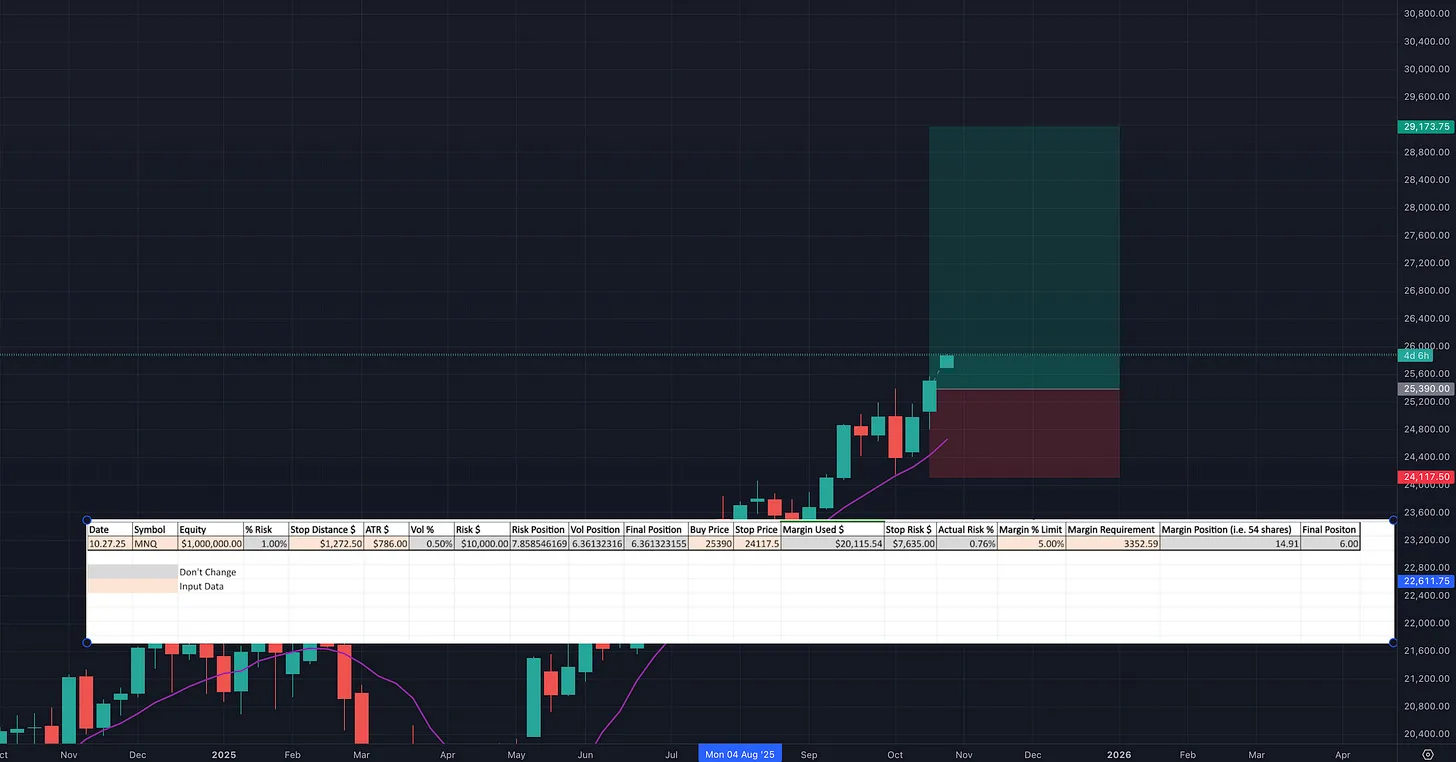
Example: Margin and Capital Constraints in Practice
With a $1 million account and Basso’s parameters (1 % risk, 0.5 % volatility, 5 % margin limit), the position size for MNQ expands to six contracts.
Even at that scale, margin used is only about 2 % of total equity — well below the 5 % cap — while total risk remains under 1 %.
This shows how Basso’s margin filter acts as a final safeguard. When risk and volatility allow larger positions, margin control ensures capital exposure still stays within safe portfolio bounds.
Combining the Methods
Tom Basso’s complete position sizing process merges all three approaches — risk-based, volatility-based, and margin-based — into one disciplined framework.
He treated each sizing method as a filter. By calculating all three separately and then selecting the smallest result, Basso ensured that no single trade ever exceeded the portfolio’s safety limits.
This process automatically adjusts for account size, market conditions, and leverage — keeping portfolio risk consistent and controlled.
Example: Stock Position
- Equity: $100,000
- XYZ Stock: $20.50 per share
- Stop-Loss: $19.05 → $1.45 risk per share
- 1 % Risk Allocation: 689 shares
- 0.75 % Volatility Allocation (ATR = $0.85): 882 shares
- 5 % Margin Allocation: 243 shares
✅ Final Position: 243 shares (smallest of the three)
Example: Futures Position
- Equity: $100,000
- 1 % Risk Allocation: 1 contract
- 0.75 % Volatility Allocation: 2 contracts
- 5 % Margin Allocation: 1 contract
✅ Final Position: 1 contract (smallest of the three)
This “smallest result wins” rule keeps your trading system self-regulating.
Risk defines how much you can lose.
Volatility defines how much the market moves.
Margin defines how much capital you can commit.
By combining them, your position sizing becomes adaptive, protective, and consistent — regardless of market type or account size.
Managing Portfolio-Level Risk (Heat)
Both Dr. Van Tharp and Tom Basso stressed that position sizing doesn’t stop at the trade level — it extends to the portfolio level. The total risk across all open positions, known as portfolio heat, determines how much capital is truly at risk at any given time.
Even if each position risks only 1%, ten correlated trades can quickly compound into 10% or more of your portfolio at risk — especially if they move together.
Their guidance was simple but powerful:
- Keep total portfolio heat below 6% of equity.
- Treat correlated trades as a single position. If five tech names move together, size them as one cluster.
- Reduce sizes when volatility spikes or correlations tighten across markets.
This keeps your capital intact during drawdowns and ensures you can always take the next trade, the hallmark of a professional risk manager.
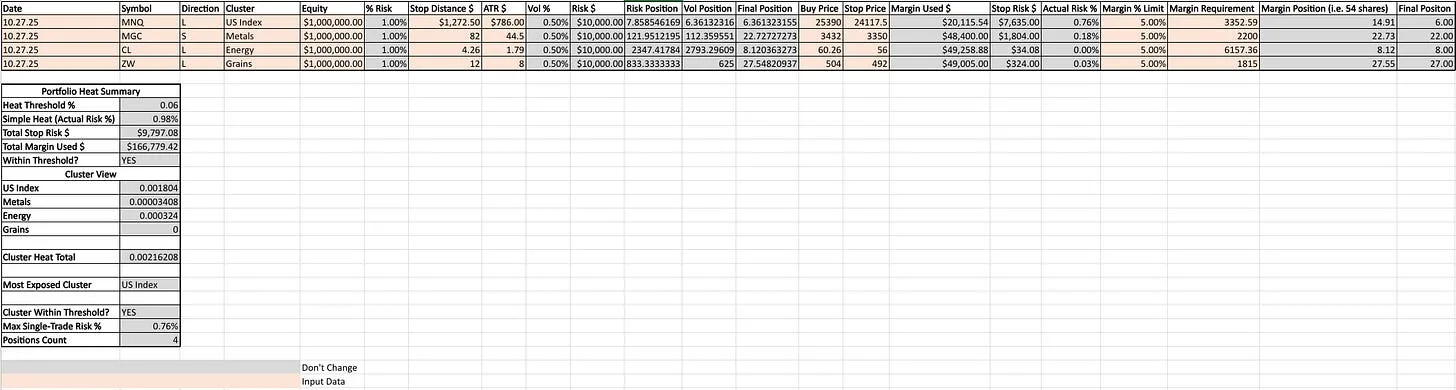
Example: Portfolio Heat Tracker
📊 Using portfolio heat tracking to manage multi-asset exposure and clustering.
Using Correlation Data to Measure Heat
The chart below shows a real example of inter-market correlations across major futures contracts from MRCI (Moore Research Center Inc.).
- Green squares show strong positive correlations (markets moving together).
- Red squares show strong negative correlations (markets moving opposite).
- Neutral colors suggest diversification potential.
If you’re long several markets shaded green, your true exposure is higher than it appears — your “1% per trade” might actually be a 4–5% cluster risk.
📊 Practical takeaway:
You can use daily correlation matrices like this to:
- Identify overlapping risks across positions (e.g., ES, NQ, YM all highly correlated).
- Group correlated trades into clusters and apply a shared risk cap.
- Dynamically adjust your portfolio heat to stay under your maximum threshold (often 6%).
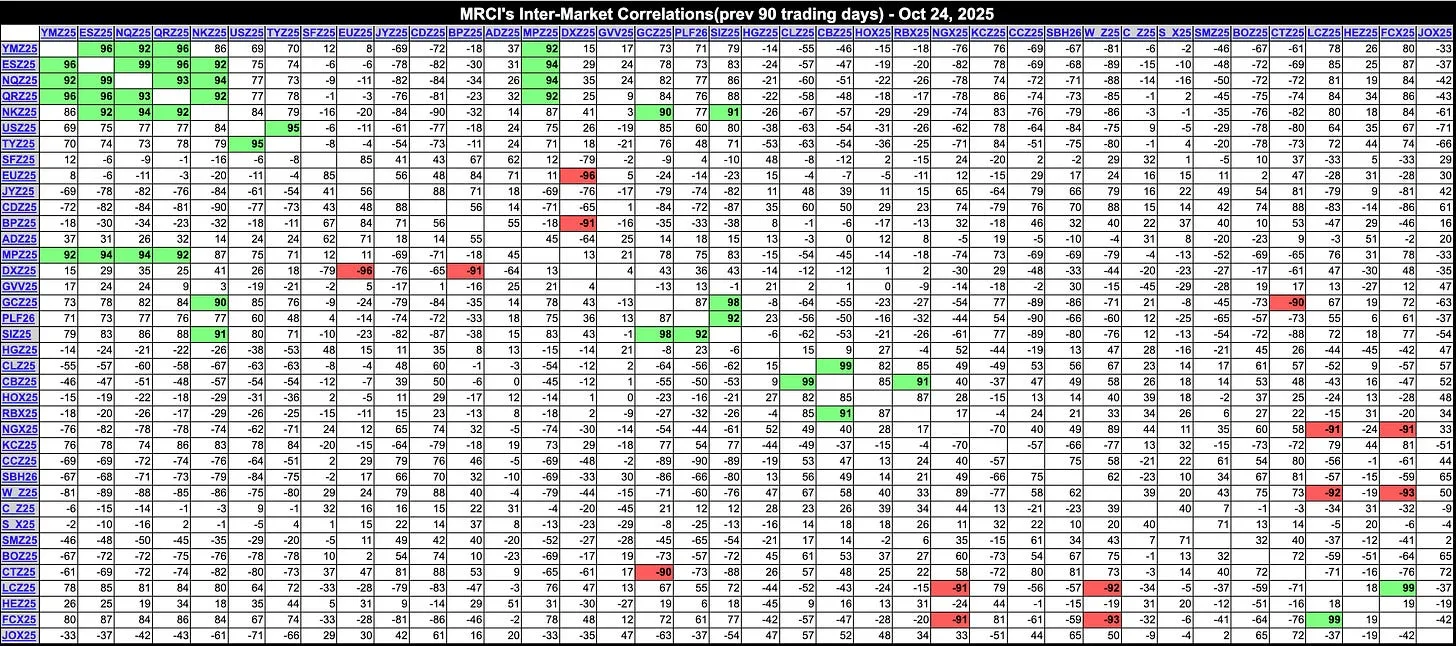
Example: Correlation Matrix for Futures Markets (MRCI)
Updated daily, this heatmap helps traders visualize how markets move together.
Strong green correlations indicate clustering — meaning those trades should be treated as one combined risk unit when calculating portfolio heat.
This ensures you maintain true diversification and avoid overexposure during market stress.
The Psychology Behind Position Sizing
Over-sizing doesn’t just hurt your account — it sabotages your mindset. When risk per trade is too high, you’re no longer trading probabilities; you’re trading emotions. Fear, hope, and regret take over, and consistency vanishes.
Under-sizing, on the other hand, leads to boredom and second-guessing. You stop caring about outcomes, which erodes discipline over time.
The sweet spot — where you can trade calmly, consistently, and without emotional interference — is where true performance begins.
Tom Basso calls this the Serenity Zone:
“Your sizing should allow you to sleep well at night while keeping your capital working effectively.”
— Tom Basso
Simulations Don’t Lie
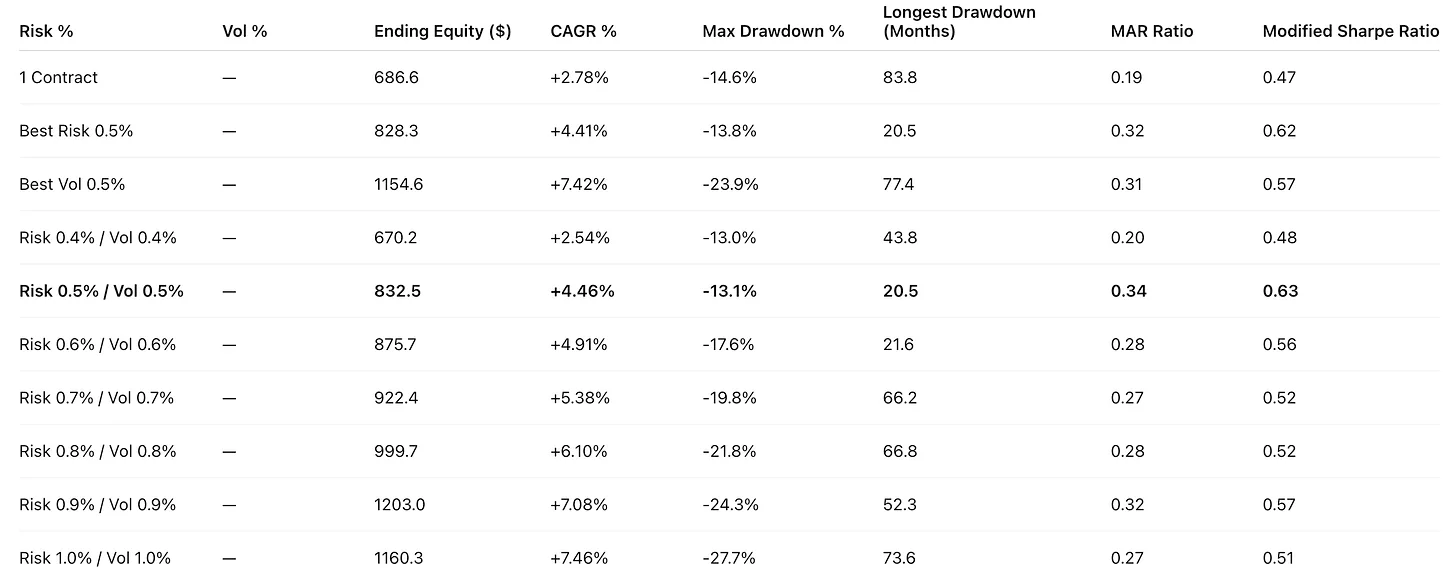
Tom Basso ran extensive simulations using futures positions and various combinations of risk and volatility allocations, all starting with $500,000 in equity.
His goal was to find which balance delivered the best growth with the smallest drawdowns.
Key Takeaways:
- The combination of 0.5% risk and 0.5% volatility allocation produced the best balance between return and drawdown.
- It achieved a +4.46% CAGR with a -13.1% max drawdown and the highest Sharpe ratio (0.63).
- Higher risk levels boosted returns but caused longer, deeper drawdowns.
- Smaller, consistent risk levels led to smoother growth and faster recovery.
This confirms what both Basso and Tharp emphasized: position sizing shapes your equity curve far more than your entry method.
“Your position sizing strategy defines the shape of your equity curve.”
– Tom Basso
Chart-Based Risk Positioning: A Practical Futures Example
While Tom Basso and Van Tharp emphasized mathematical position sizing, many traders apply those same principles visually — directly from their charts.
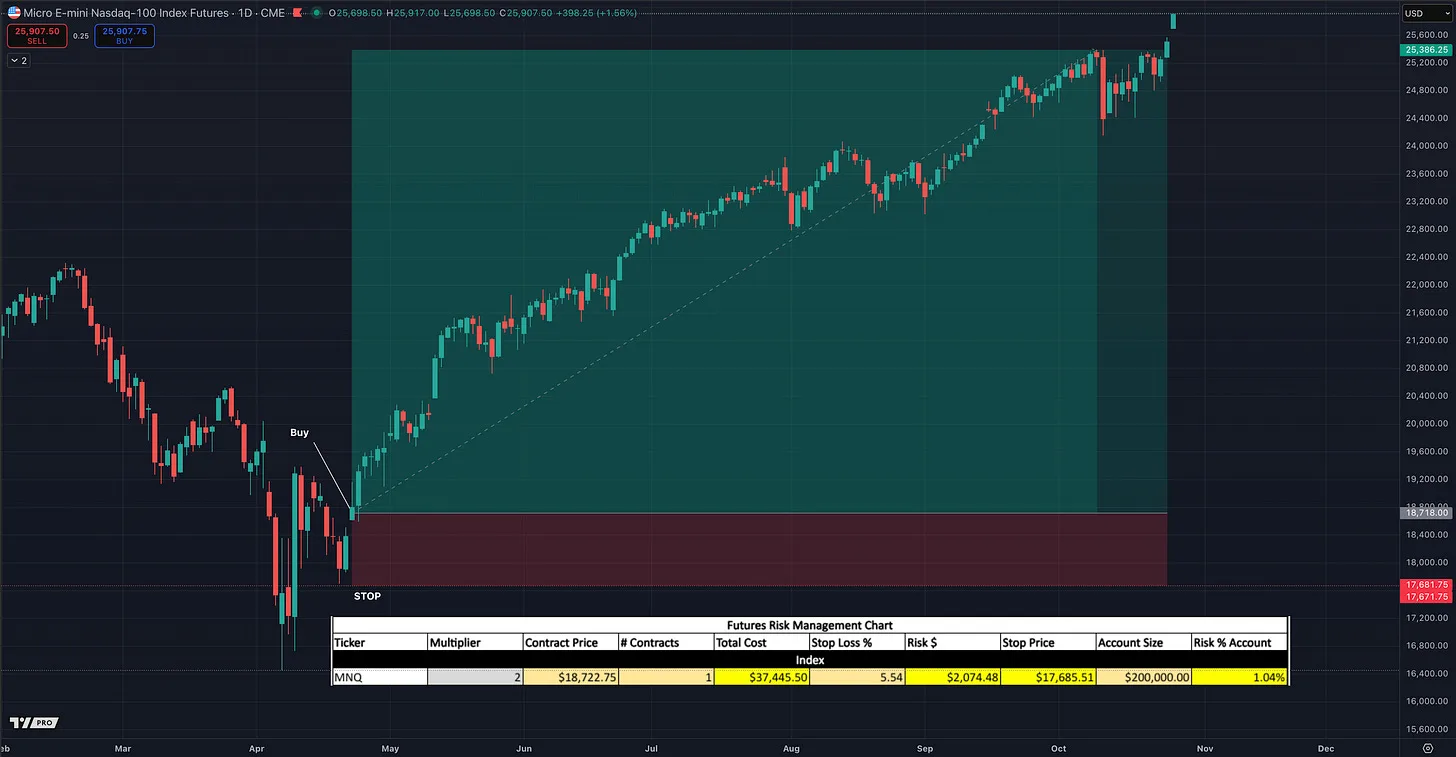
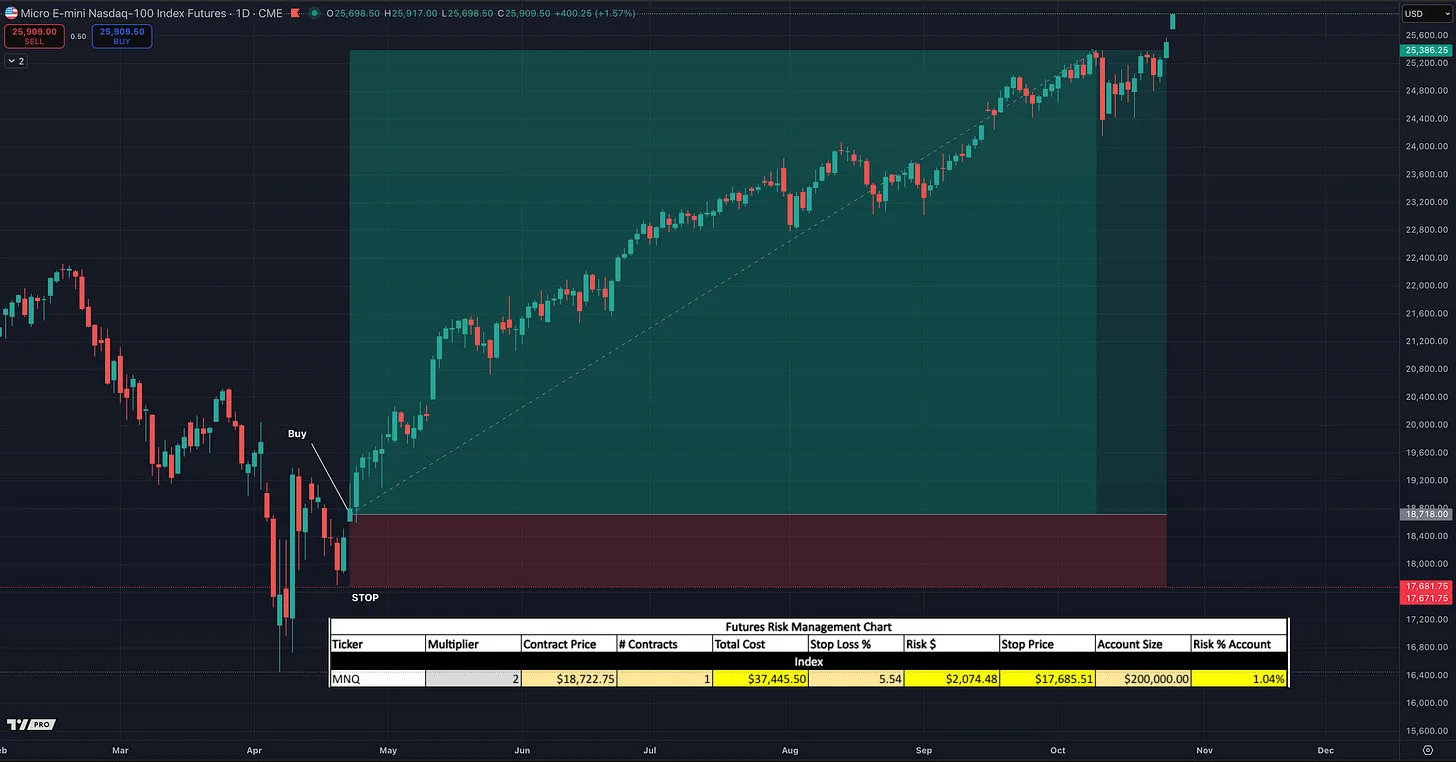
In this example using Micro Nasdaq futures (MNQ):
- The entry is placed after a higher low.
- The stop is set just below that low — 5.54% from the entry price.
- Using a $200,000 account and a 1% maximum risk rule, the spreadsheet calculates that 1 contract equals 1.04% risk, while 2 contracts would exceed the limit at 2.07%.
The trader then scales down to 1 contract, keeping the position within the defined risk boundary.
This method visually aligns stop placement with structure, while quantitatively enforcing portfolio discipline — a perfect balance between chart intuition and risk mathematics.
In essence:
It’s the same principle Basso and Tharp taught — define your risk first — but applied in a chart-integrated, intuitive way suited for active futures traders.
The Goal: Calm, Controlled, and Consistent
Trading isn’t about prediction, it’s about precision in exposure. Position sizing gives you that control. When you know exactly how much you can lose, every trade becomes just another R, not a threat.
That’s the mindset of professionals — calm, systematic, and consistent.
They don’t chase outcomes; they manage risk.
Over time, that serenity compounds just like equity does.
📚 Further Reading
- Dr. Van K. Tharp — The Definitive Guide to Position Sizing Strategies
- Tom Basso — Successful Traders Size Their Positions: Why and How
These works explore the math, psychology, and simulations behind the ideas discussed above. They are essential reading for anyone serious about mastering risk and capital management.
I’ll also be publishing follow-up posts that build on this foundation — including:
- How to Develop a Trading System that produces consistent, measurable expectancy.
- Deep Dives into Key Metrics such as expectancy, MAR ratio, and portfolio heat — how to calculate, interpret, and apply them to real position sizing models.
- Practical Tools and Templates you can use to track your own system performance and risk exposure.
The goal is to connect the theory, math, and psychology of position sizing into a complete framework — so you can trade with precision, consistency, and confidence.
More in Legendary Traders
All Legendary Traders articles →
Sep 17, 2026 · Legendary Traders
4 Legendary Traders. 4 Breakout Entry Tactics.
A chart-by-chart breakdown of Minervini’s VCP, O’Neil’s cup with handle, Darvas’s box breakout, and Kullamägi’s opening range breakout.
- how to make money in stocks
- IBD
- Momentum Trading
- VCP
- technical analysis
- CANSLIM
- Trading Setups
- position trading
Sep 6, 2026 · Legendary Traders
Market Wizard David Ryan: How He Made 1,379% in Three Years
Inside the growth-stock approach of William O’Neil’s protégé and three-time U.S. Investing Champion, from precise entries to holding major winners.
- IBD
- fundamental analysis
- Learn Trading
- technical analysis
- position trading
- David Ryan
- Market Wizard
- CAN SLIM
Aug 29, 2026 · Legendary Traders
Why the Market’s Biggest Winning Stocks Rarely Move Alone
Lessons from Nicolas Darvas, William O’Neil, and Mark Minervini on using industry-group strength and relative strength to find new market leaders without getting whipsawed.
- growth stocks
- CANSLIM
- position trading
- David Ryan
- stock trading
- Kristjan Kullamägi
- Nicolas Darvas
- industry groups