
Trading articles/Growth Stock and Momentum Trading: What It Is and What It Isn’t
Sep 6, 2026 · Momentum Trading Strategy
Growth Stock and Momentum Trading: What It Is and What It Isn’t
What 100 Years of Stock Charts Reveal About Growth-Momentum Trading, and Where Personal Style Ends and a Different Strategy Begins
Originally published on Substack.
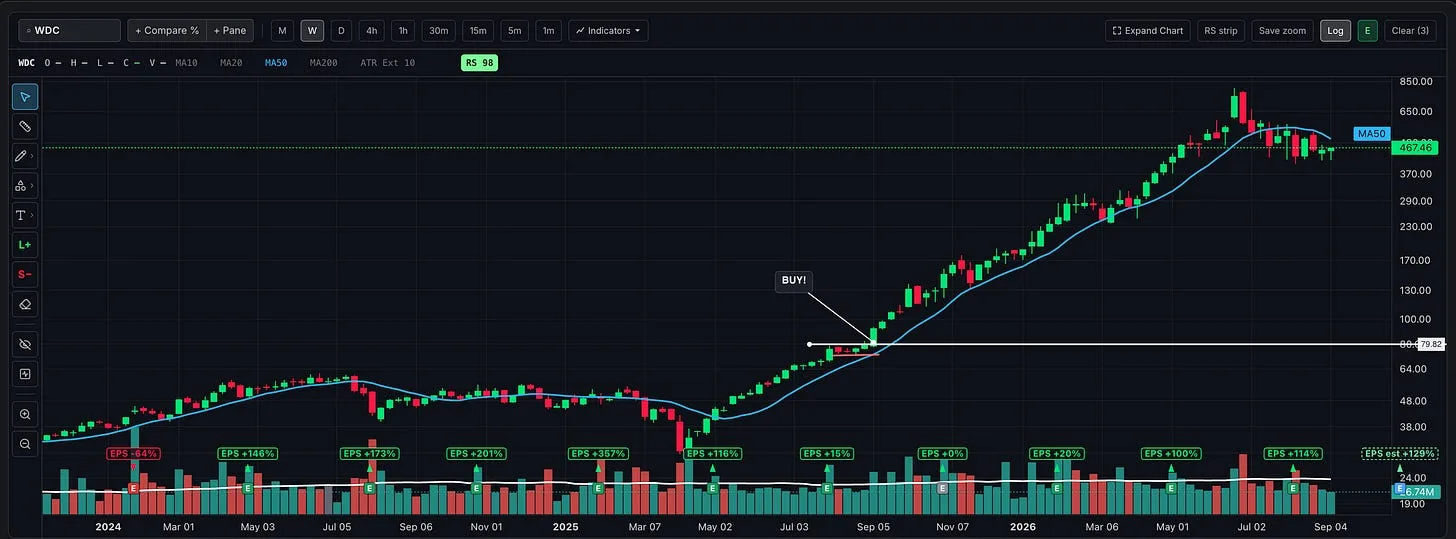
People often ask me what growth stock and momentum trading actually is. Some are discovering the approach for the first time. Others believe they are following it, but their reasons for buying and holding may belong to a different strategy altogether.
At the same time, following the same broad approach does not mean we all have to trade identically. We can use different setups, hold for different lengths of time, sell into strength differently, and use different rules for stop placement and position sizing. Some traders apply strict CANSLIM fundamental requirements, while others make selective exceptions when price leadership is exceptional.
Those differences can exist within a shared foundation: buying stocks that are demonstrating strength, entering through a qualified setup, and respecting a defined plan for getting out.
But buying a stock as it crashes toward its 52-week low beneath declining moving averages, or accumulating inside an unproven bottom because it looks cheap, involves a different entry philosophy. Holding a failed trade because we believe in its long-term potential also changes the original premise. Those decisions fall outside the classic O’Neil-style growth investing and momentum approach discussed here.
In this article and the accompanying video, we will work through 100+ years of stock charts from William O’Neil’s How to Make Money in Stocks**, along with examples from my own chart collection.** We will examine what these opportunities looked like before their major advances, where the evidence of strength developed, and how different traders could approach the same stock.
O’Neil’s work will be our foundation, with lessons from Minervini, Ryan, and Zanger helping explain the variations in execution. We will look at the setups, trends, entries, and exits that define this approach, alongside examples of trades built on a different premise.
The purpose is to recognize which differences personalize the strategy and which ones change the strategy itself.
Start with the CAN SLIM Framework
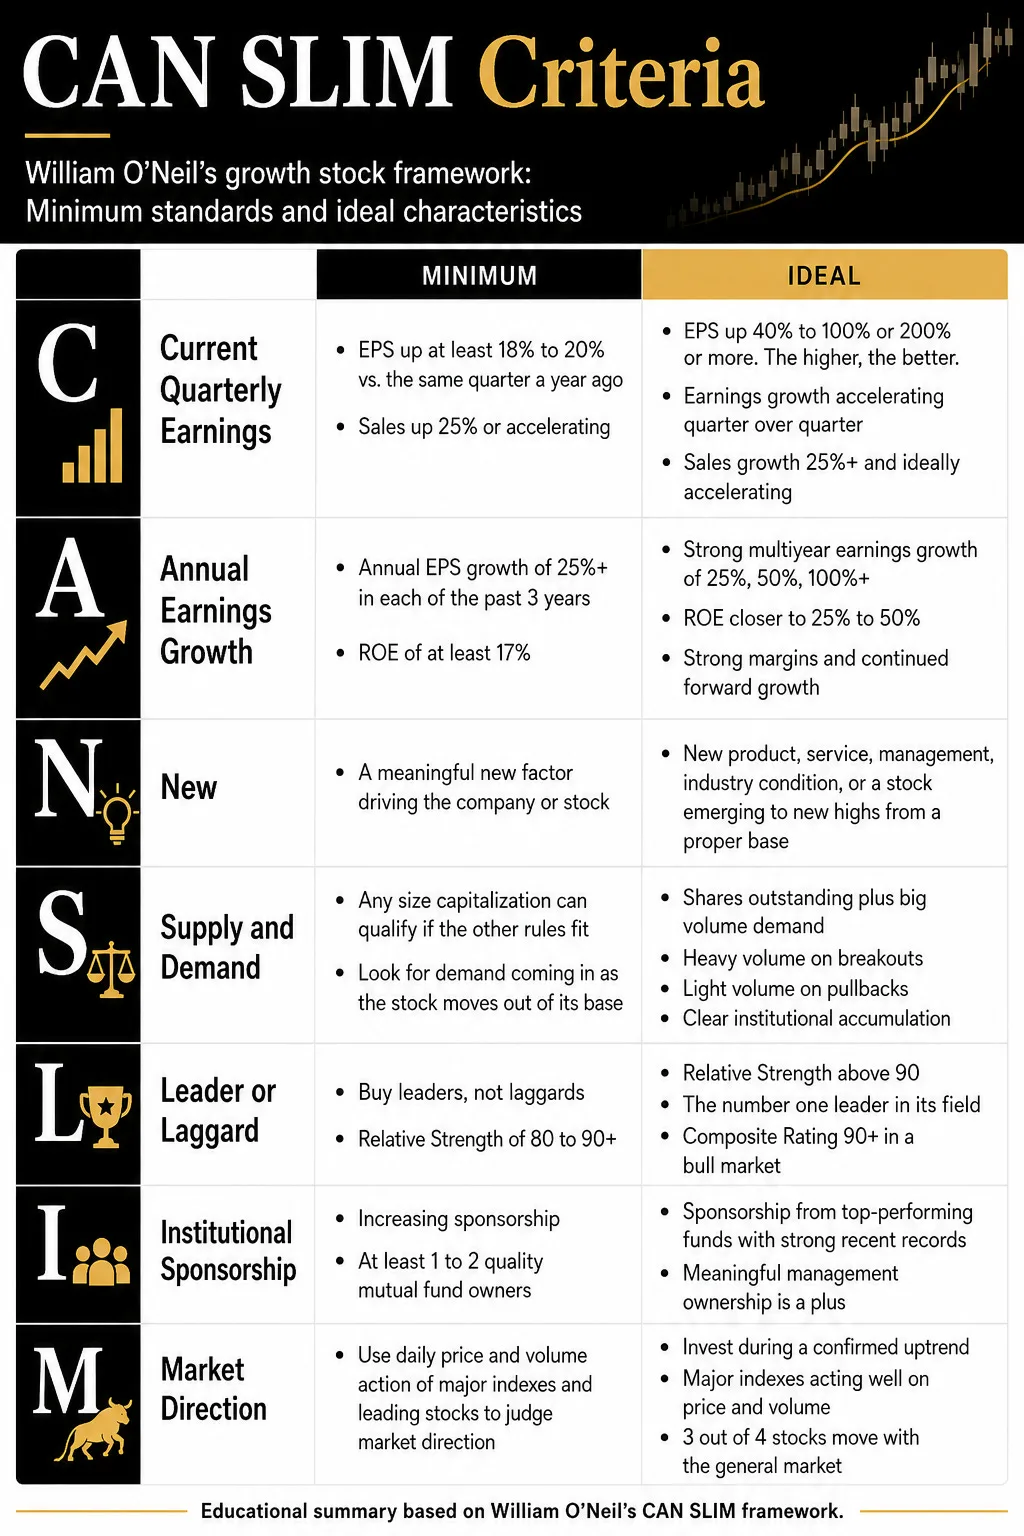
William O’Neil’s CAN SLIM framework brings together growth fundamentals, price leadership, institutional demand, and market direction. This overview gives us a foundation for understanding the chart examples that follow.
As we’ll discuss, traders can differ in how strictly they apply certain fundamental criteria. Understanding the original framework helps us recognize which differences are adaptations and which represent a different approach.
As presented in How to Make Money in Stocks:
- C: Current Quarterly Earnings per Share
The Higher, the Better - A: Annual Earnings Increases
Look for Significant Growth - N: New Products, New Management, New Highs
Buying at the Right Time - S: Supply and Demand
Shares Outstanding Plus Big Volume Demand - L: Leader or Laggard
Which Is Your Stock? - I: Institutional Sponsorship
Follow the Leaders - M: Market Direction
How to Determine It
The Foundation Is Buying Demonstrated Strength with a Defined Plan for Managing Risk
The approach I predominantly teach is O’Neil-style growth momentum trading. We look for leading stocks, strong or improving business performance, evidence of institutional demand, and constructive price action. We enter through a qualified setup and exit when the trade violates our exit rules.
The growth side focuses on the business: earnings, sales, profit margins, return on equity, and meaningful developments such as new products, services, management, or industry changes. The momentum side focuses on the stock: relative strength, an advancing trend, strength near price highs, and constructive price and volume behavior. O’Neil’s CAN SLIM framework combines these considerations with supply and demand, institutional sponsorship, and the direction of the overall market.
Here, I am describing the particular growth momentum approach rooted in O’Neil’s work.
He states the buying philosophy clearly in How to Make Money in Stocks:
“You buy stocks when they’re nearer to their highs for the year, not when they’ve sunk so low that they look cheap.”
He also emphasizes adding after a purchase moves in your favor and cutting losses quickly. A compelling company story does not override those disciplines.
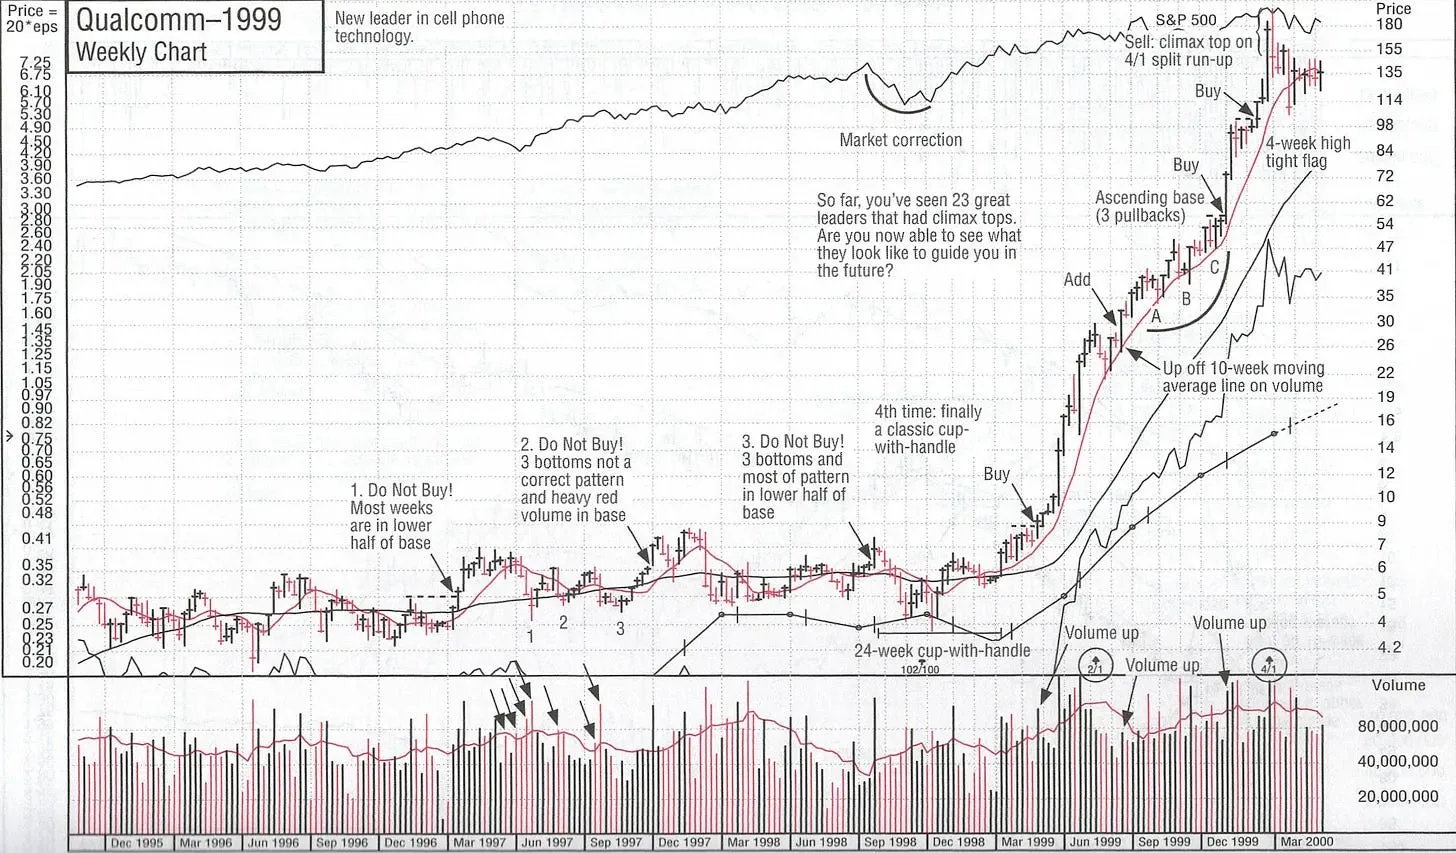
Qualcomm (1999): O’Neil labels the early bottoming attempts “Do Not Buy.” The stock had stopped falling, but it had not yet formed a proper pattern or demonstrated sufficient strength.
A Stock That Has Stopped Falling Has Not Necessarily Started a Sustainable Advance
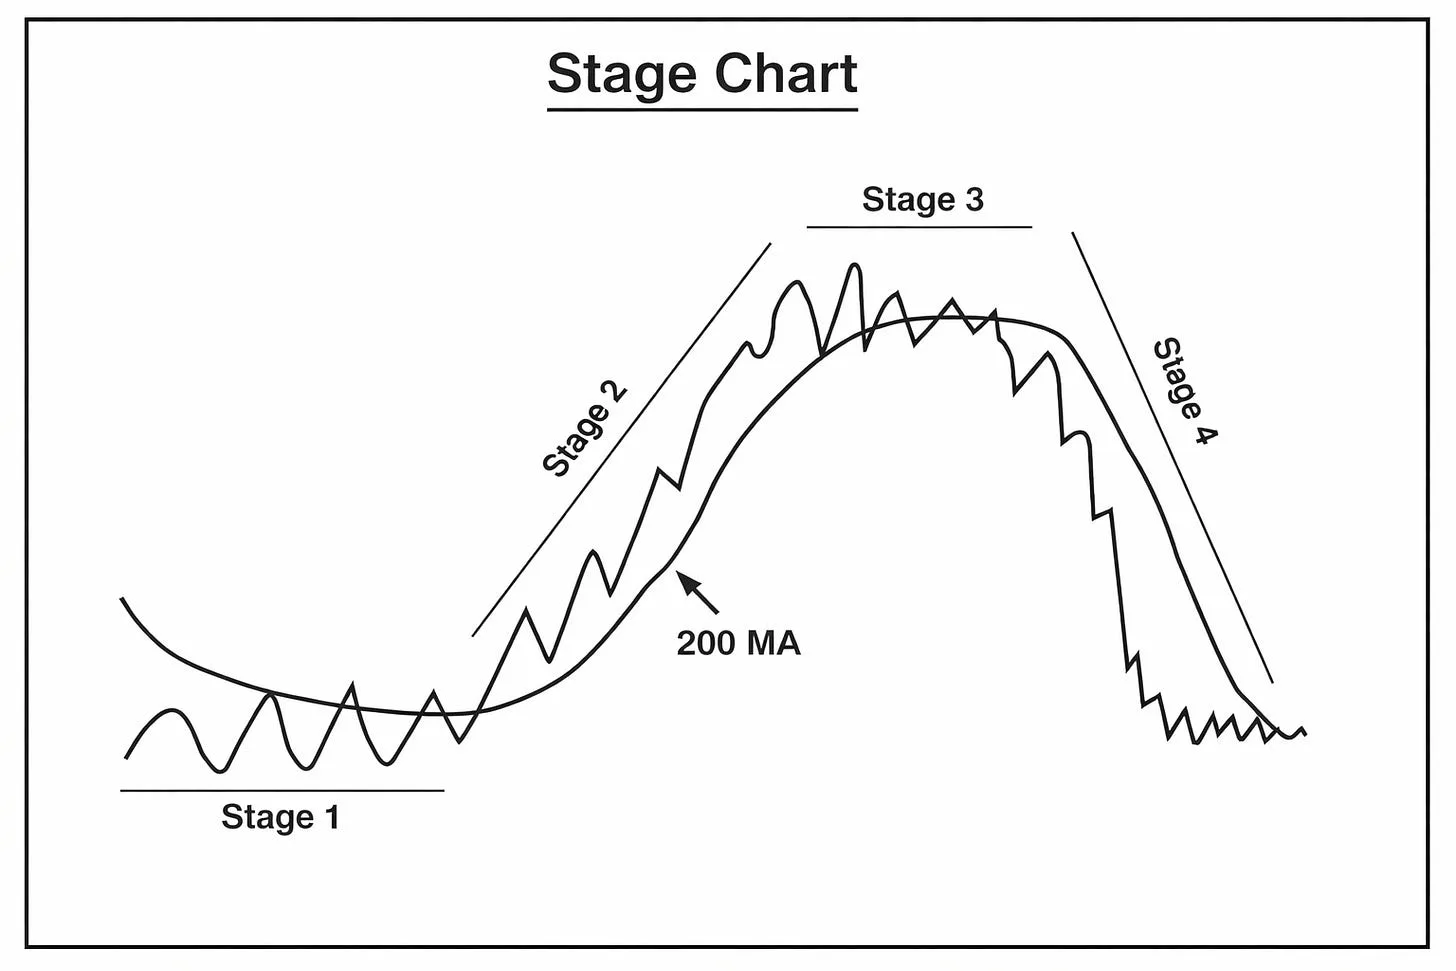
We Only Buy Confirmed Stage 2 Uptrends
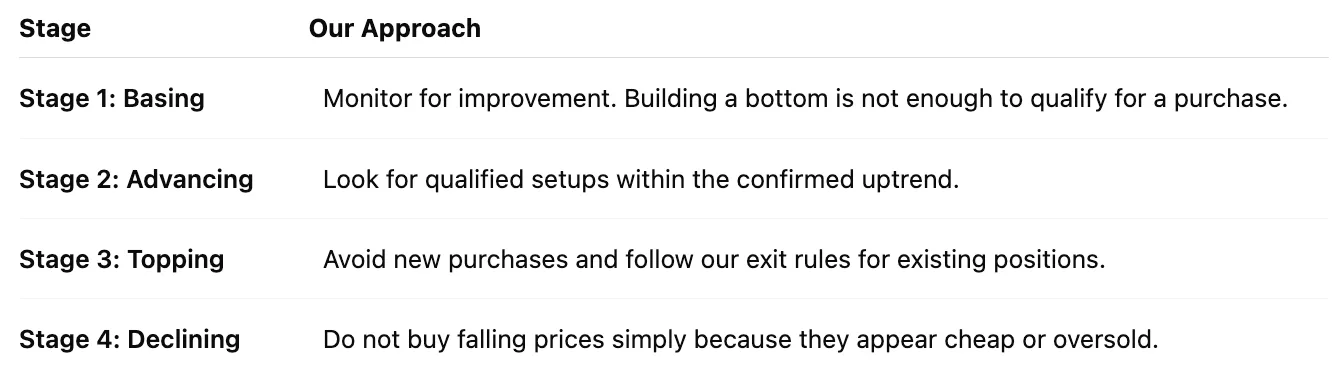
Stan Weinstein’s framework divides a stock’s cycle into four stages: Stage 1 is the basing phase, Stage 2 is the advancing phase, Stage 3 is the topping phase, and Stage 4 is the declining phase.
For the strategy I teach, a confirmed Stage 2 uptrend is a requirement before we consider buying. A stock holding support near its lows does not qualify simply because it has stopped falling. Strong fundamentals, an attractive price, or a convincing long-term story do not replace that requirement.
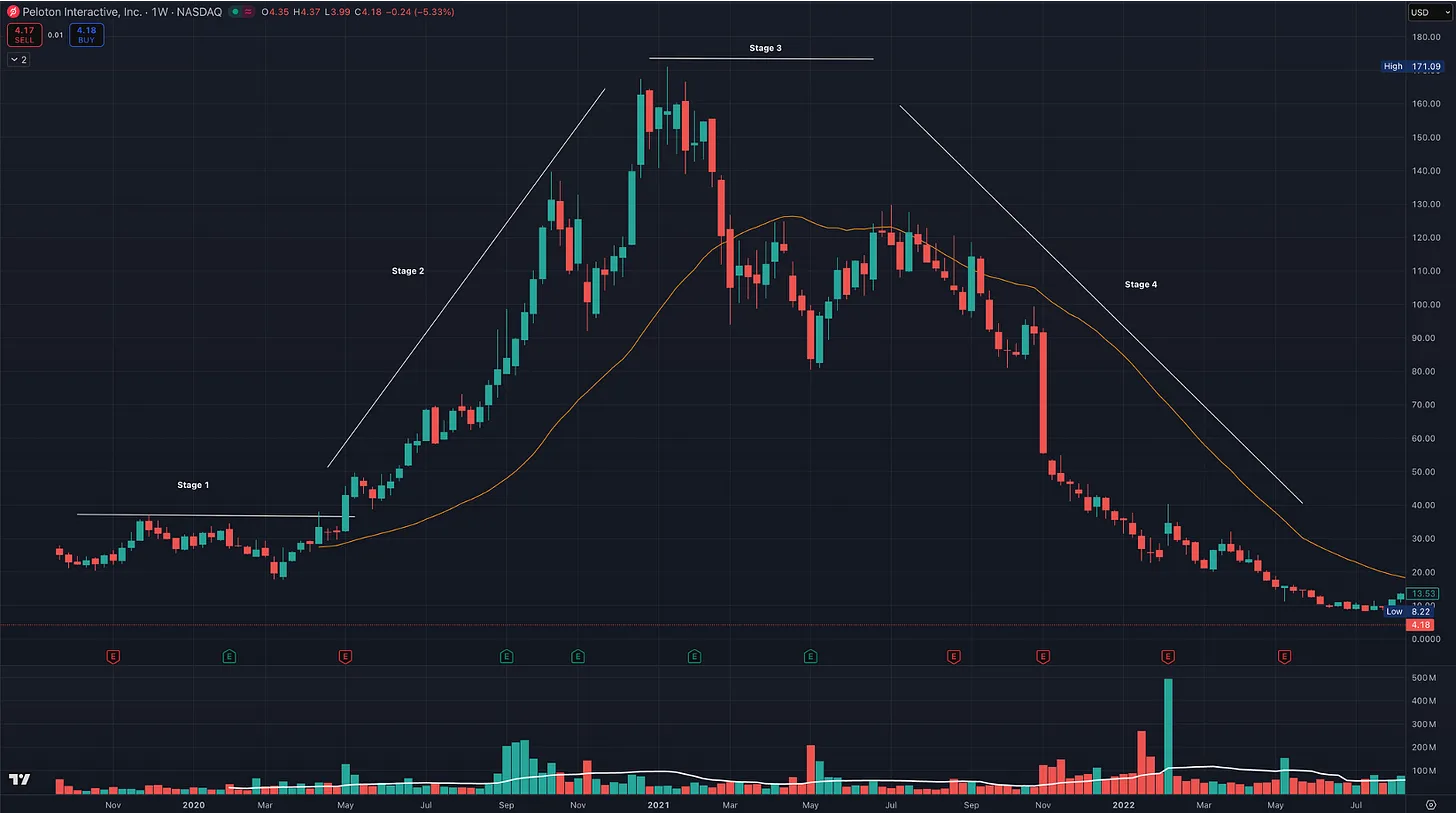
A Stage 2 stock can still pull back, consolidate, and build bases. That is where we look for our setups. A constructive consolidation within an established uptrend is different from a stock building a bottom after a prolonged decline.
Stage 2 qualifies the trend. The setup, entry point, and risk determine whether we take the trade.
Buying Strength Still Requires a Suitable Entry
A stock is not automatically a buy because it is making new highs. O’Neil emphasizes proper bases and precise buy points, while warning against chasing stocks too far beyond those entries. He also explains that a handle breakout can occur below the stock’s previous high.
The distinction is between the stock’s trend and your entry location. A strong uptrend identifies a potential candidate. A qualified setup identifies where the risk may be manageable.
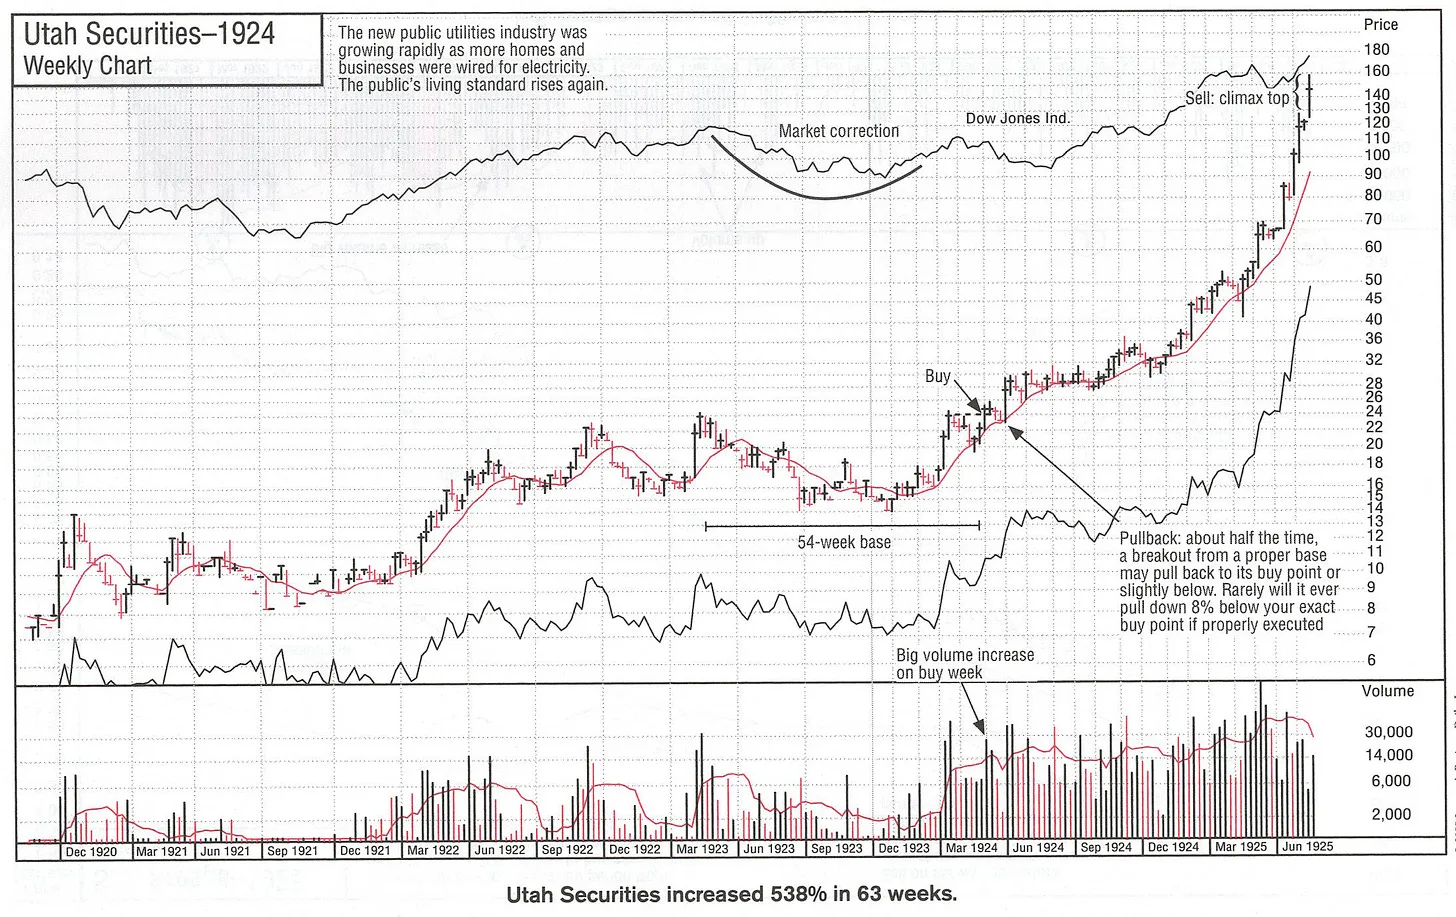
In the Utah Securities (1924) example, O’Neil marks the buy point as the stock breaks out of a 54-week cup-with-handle base. By that point, price has recovered toward its previous highs, the moving average is rising, and the stock is demonstrating strength.
Notice the relationship between price and volume. Volume contracts during portions of the consolidation, then increases sharply during the breakout. O’Neil specifically highlights the “Big volume increase on buy week.” The handle provides a tighter area for identifying an entry and defining risk.
The marked purchase is not at the bottom of the base simply because the stock appears inexpensive. It comes after the stock has strengthened and moves through a proper buy point.
For the strategy I teach, we only buy confirmed Stage 2 uptrends. We can differ in the setups we favor, how we manage risk, and how long we hold. Buying an unproven Stage 1 bottom or a declining Stage 4 stock is outside that framework.
Different Setups Can Express the Same Underlying Approach
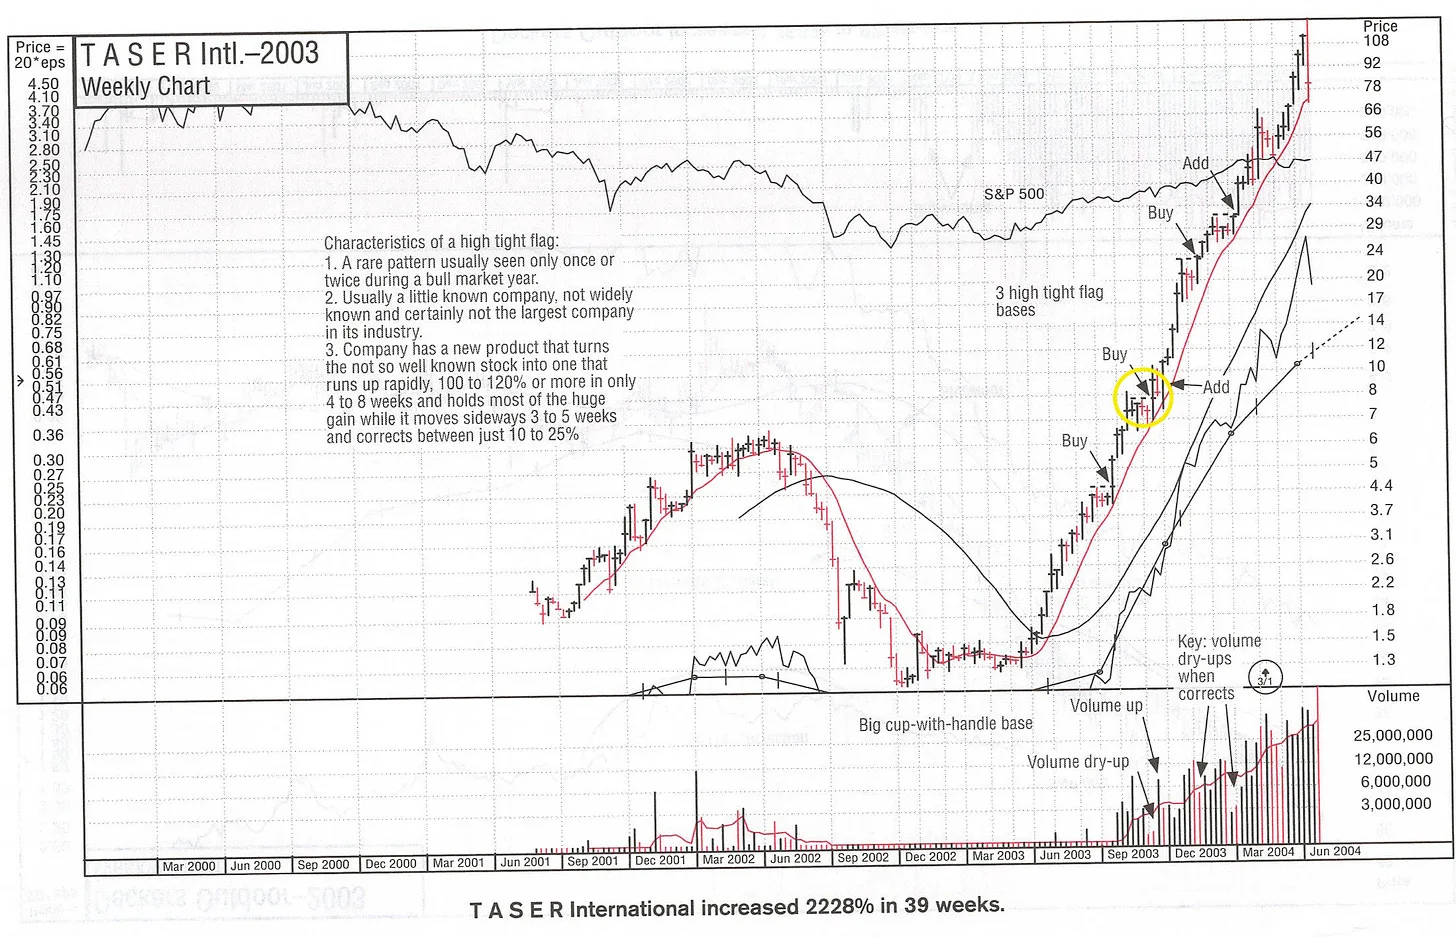
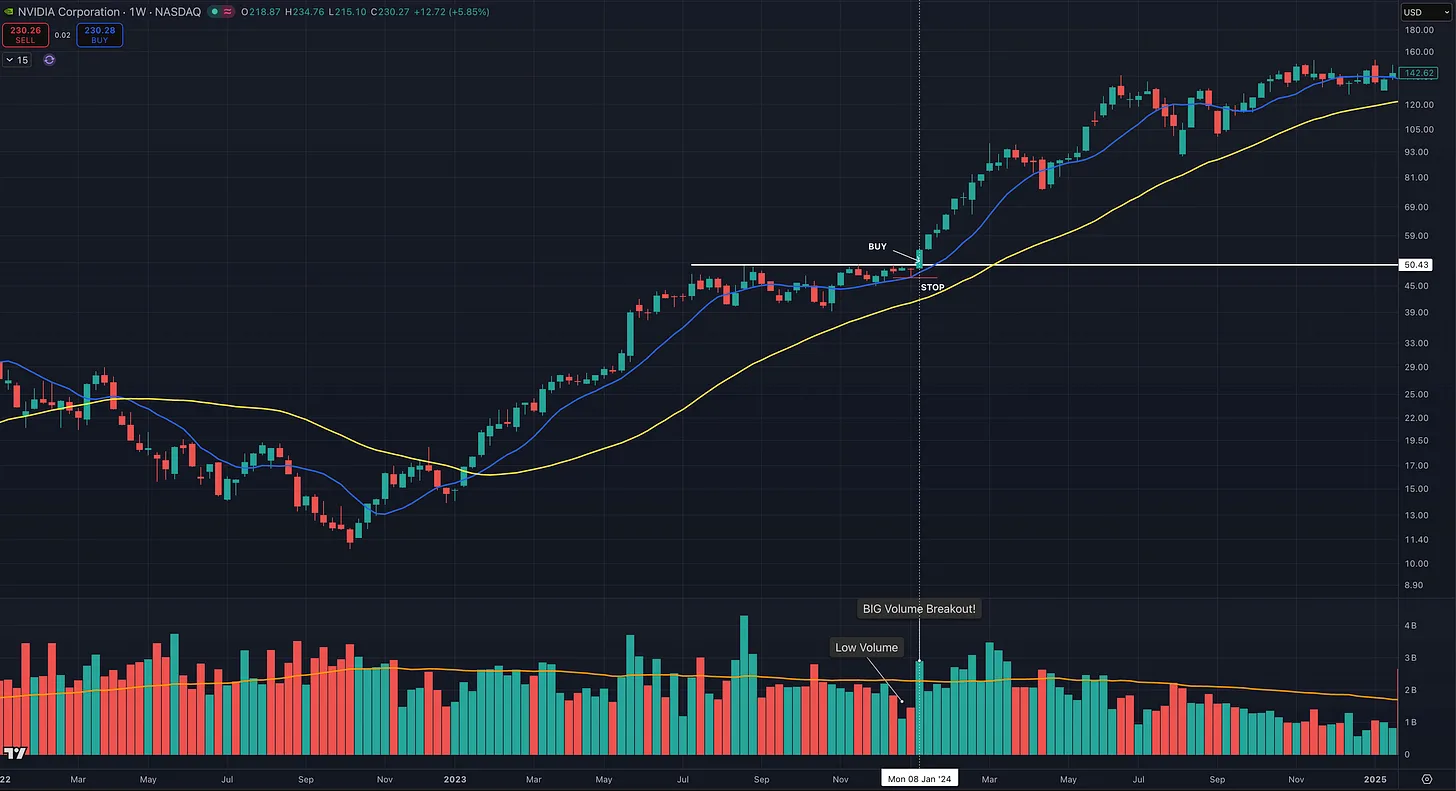
One trader might specialize in cup-with-handle breakouts. Another might prefer VCPs or flat bases. Someone else may favor bull flags or pennants, while another trader avoids them. In fact, I’ve noticed quite a few traders here are hesitant to trade flags and pennants because they feel the stock is already “too extended.”
Those preferences can differ while we’re still following the same foundation: buying qualified setups within confirmed Stage 2 uptrends.
These preferences do not automatically put the traders in different strategic categories. They can all be looking for an advance, a constructive pause, and a new entry supported by price action.
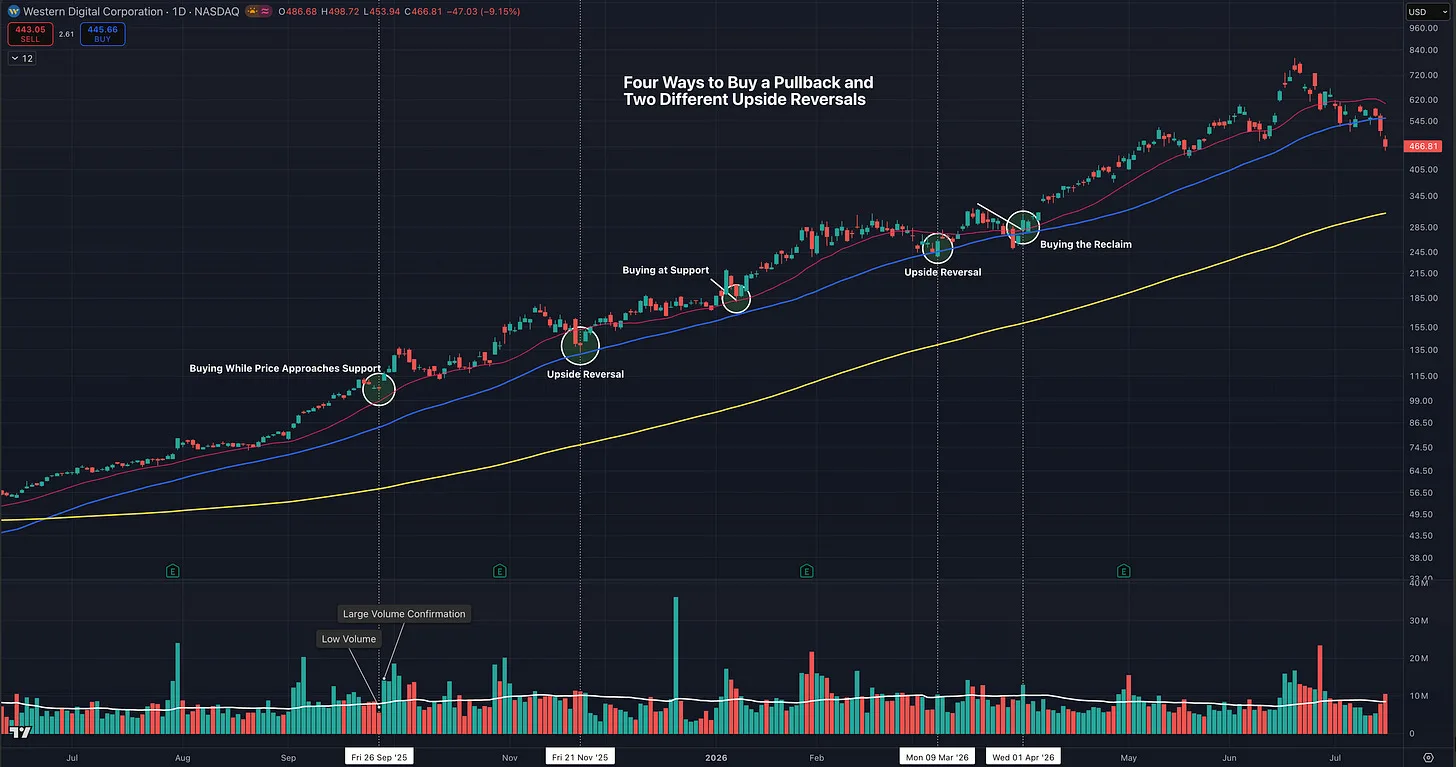
Pullbacks can fit this framework too. Both Minervini and Ryan discuss pullback entries in Momentum Masters. Buying a controlled pullback in an established leader is different from buying a collapsing stock because it has fallen substantially.
A stock advancing from $40 to $80 and then pulling back constructively to $74 presents a different situation from one falling from $80 to $30 and lingering near its lows. Both are below a previous high. Their price structures are very different.
Time Frame Changes How We Manage the Opportunity
Time frame affects how long we hold a position and how we manage the trade. It does not necessarily change the foundation of the strategy.
Minervini describes swing trading in and out of stocks to compound capital, while Ryan emphasizes holding winners as long as the uptrend remains healthy. Those are tendencies, not rigid rules. Minervini may hold an exceptional winner for multiple quarters, while Ryan will exit immediately if a new position hits his stop.
O’Neil also combines profit-taking rules with provisions for holding exceptional winners longer. Position trading does not mean holding every purchase for years or tolerating unlimited losses. The longer holding period applies to stocks that continue acting correctly.
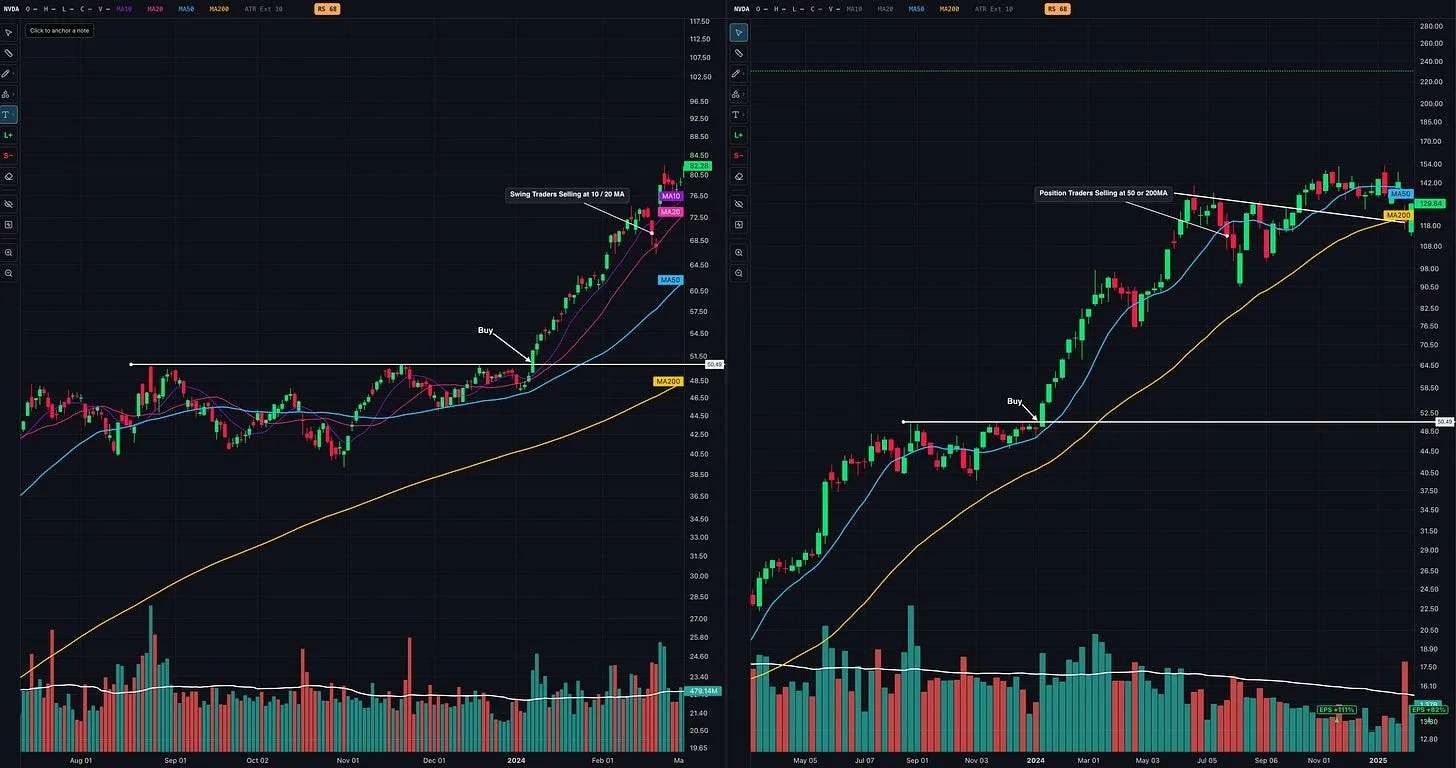
NVDA illustrates how the same opportunity can be managed differently depending on the trader’s time frame.
In this example, both traders enter at the same breakout. The swing trader may capture the faster move and begin selling as price loses the shorter-term 10-day or 20-day moving averages. The position trader may give the stock more room and use the 50-day or 200-day moving average, along with the larger price structure, to participate in a longer advance.
They do not have to use the same entry, either. One trader may enter on an early cheat, pullback, or pullback reversal, while another waits for the traditional breakout. These are differences in execution, not necessarily differences in the underlying strategy.
Many newer traders confuse a trader’s time frame with the time frame of the chart being viewed. They are related, but they are not the same thing. A setup can be visible on the weekly chart that is not as clear on the daily chart. A shorter and tighter setup may also appear on the daily chart without creating a distinct pattern on the weekly chart.
Ideally, as we see in this NVDA example, the daily and weekly charts are aligned. The weekly chart confirms the larger Stage 2 uptrend and overall price structure, while the daily chart provides a more precise view of the setup, entry, and risk.
David Ryan is primarily a position trader, but he studies both daily and weekly charts. Minervini generally trades shorter-term swings, but he also uses both. A swing trader may naturally rely more heavily on the daily chart for setups, entries, and trade management while using the weekly chart for context. A position trader may rely more heavily on the weekly chart for the larger trend and base structure while using the daily chart to refine entries and risk.
The chart time frame is the lens being used. The trading time frame is how the position is managed. A position trader generally seeks to compound by giving winning stocks more time to produce larger gains, while a swing trader seeks to compound the account through greater trade frequency and more frequent reinvestment of capital.
What they share is more important: both are buying a high-relative-strength leader in a confirmed Stage 2 uptrend with constructive price and volume characteristics.
Fundamental Requirements Can Vary Without Removing the Emphasis on Strength
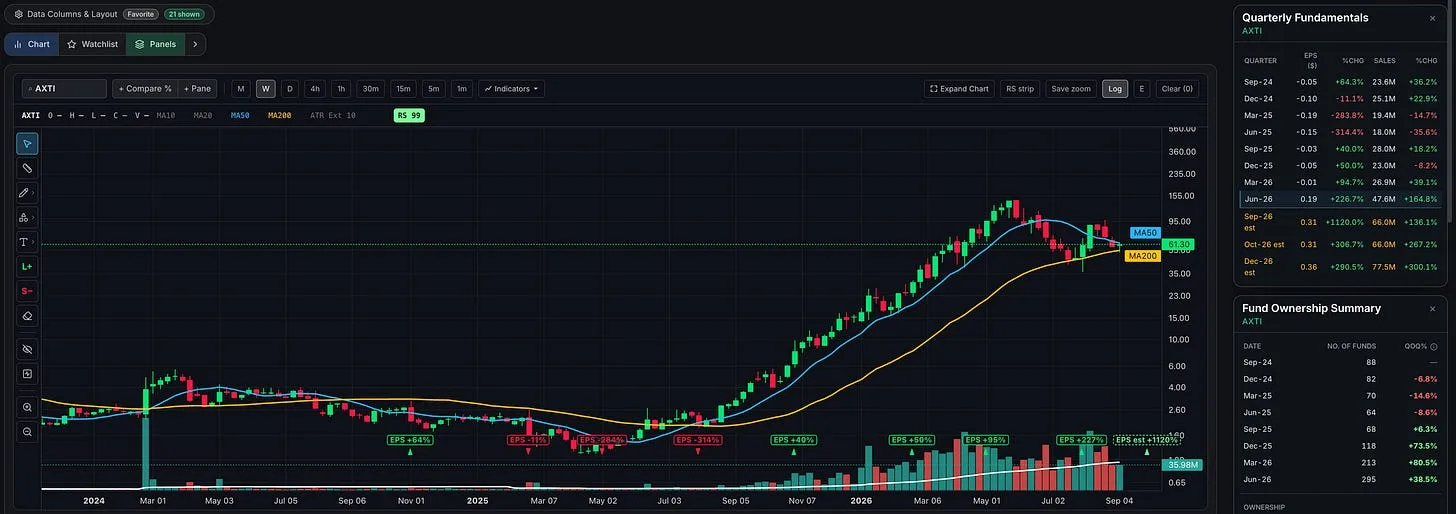
In Momentum Masters, Minervini explains that he may buy exceptional technical strength even when the supporting fundamentals are not yet apparent, particularly in certain biotech and medical stocks. Ryan generally prefers stocks with both technical and fundamental strength, although he acknowledges taking occasional trades based primarily on technical action. Zanger similarly observes that a stock can begin a powerful advance before its reported earnings fully reveal the underlying growth.
These are differences in emphasis, not rejections of growth fundamentals. All three traders still place enormous importance on earnings and sales growth, market leadership, institutional demand, and many of the characteristics O’Neil organized within CAN SLIM. They also acknowledge the influence of O’Neil’s How to Make Money in Stocks on their development as traders.
A stock can therefore qualify as a price and momentum leader without passing every requirement of a strict CAN SLIM screen. That represents a variation in stock selection within the broader growth-momentum tradition. It does not make deteriorating price action irrelevant, and it does not turn a stock declining toward its lows into a momentum candidate.
Qullamaggie’s breakout method provides another example from the more technically focused side of the same tradition. He describes screening for stocks in the top 1% to 2% by performance over one, three, and six months, which directly emphasizes high relative strength. He then looks for a powerful prior advance, an orderly consolidation, and a breakout.
He may not require every CAN SLIM fundamental characteristic, but his process still begins with exceptional relative strength. He is looking to buy confirmation and continuation after a strong stock forms a qualified setup, not weakness simply because a stock appears cheap near its lows.
Qullamaggie has also credited How to Make Money in Stocks as an important influence and learned from traders such as Zanger and Stockbee, who were influenced by the same growth-momentum lineage.
This is why the Momentum Trading Strategy I teach is not an arbitrary collection of rules invented in isolation. The specific screens, setups, and trade-management techniques have evolved, but the common foundation remains: identify leading stocks, buy demonstrated strength through a qualified setup, define the risk, and exit when the price action invalidates the trade.
The fundamental requirements can vary. The requirement for demonstrated price strength cannot.
A Winning Trade Can Still Be a Bad Trade If It Violates Your Strategy
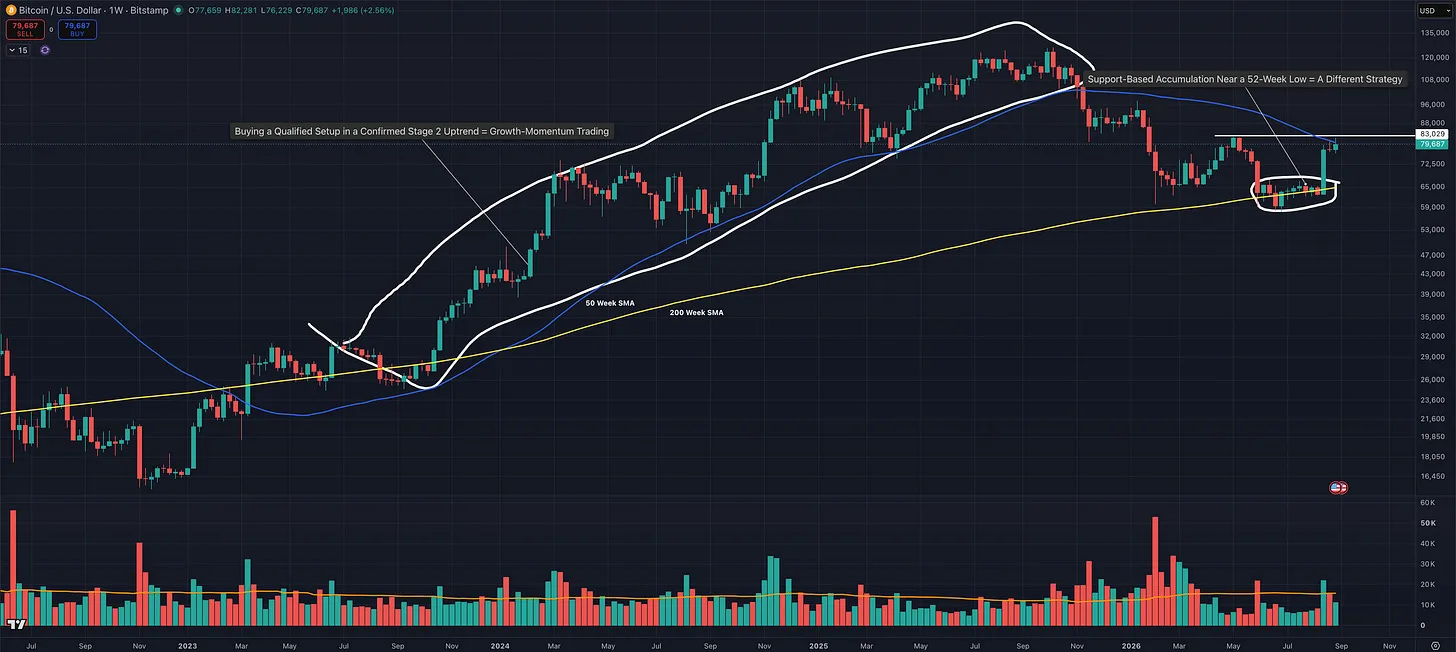
This article was partly inspired by one of our paid members who clearly understands trading and has shared several excellent trade ideas, including stocks that I had missed. He bought Bitcoin near the 200-week moving average, came remarkably close to identifying the bottom, and is now sitting on a phenomenal trade.
The trade inspired this article not because it was unsuccessful, but because it was so successful. A profitable outcome can make it difficult to recognize that the trade may have been based on a completely different strategy.
If his plan was to accumulate Bitcoin near major long-term support when it became extremely oversold, then it was an excellent trade within that strategy. If he tracks that strategy separately, understands its risks, and applies its own entry and exit rules, there is absolutely nothing wrong with it.
However, if the same purchase were treated as part of a growth and momentum system, it would be an out-of-system trade. The fact that it made money would not change that.
Within the strategy taught here, we are not attempting to identify exact bottoms or buy something simply because it appears cheap near a 52-week low. We concentrate on high-relative-strength leaders in confirmed Stage 2 uptrends. We want constructive consolidations, qualified setups, and evidence that price and demand are already moving in our favor.
This is almost the opposite of the traditional “buy low and sell high” mentality. We are willing to buy at a considerably higher price than the absolute low because we are paying for confirmation. We are trying to buy strength and sell even higher, not buy weakness and hope it eventually becomes strength.
Dr. Van Tharp has discussed traders operating multiple systems for different market environments, sometimes separating those systems into different trading accounts. That is perfectly acceptable. Each system can have its own purpose, market conditions, entries, exits, position sizing, and performance record.
The danger is not trading more than one system, but unknowingly mixing different systems and treating them as if they were one.
One day, a trader buys weakness because something appears oversold. The next day, the trader buys strength through a breakout. Then a failed momentum trade is converted into a long-term investment because the trader still believes in the asset. These decisions may all belong to valid strategies individually, but they do not belong in the same set of rules or performance data.
Once they are mixed together, the trader can no longer determine which setups are actually working, whether the original rules were followed, or where the profits and losses are coming from. The journal is measuring several different strategies while presenting them as one.
That is why a winning trade can still be a bad trade. If it violated the rules of the strategy you intended to follow, the profit may reinforce behavior that damages your process over time. Conversely, a properly executed trade can lose money and still be a good trade.
Bitcoin and IBIT can be traded using technical momentum principles, but the price requirements must be identified honestly.
You can trade more than one system. What you cannot do is mix their rules and still expect your performance data to tell you the truth.
The Most Damaging Change Often Happens After the Purchase
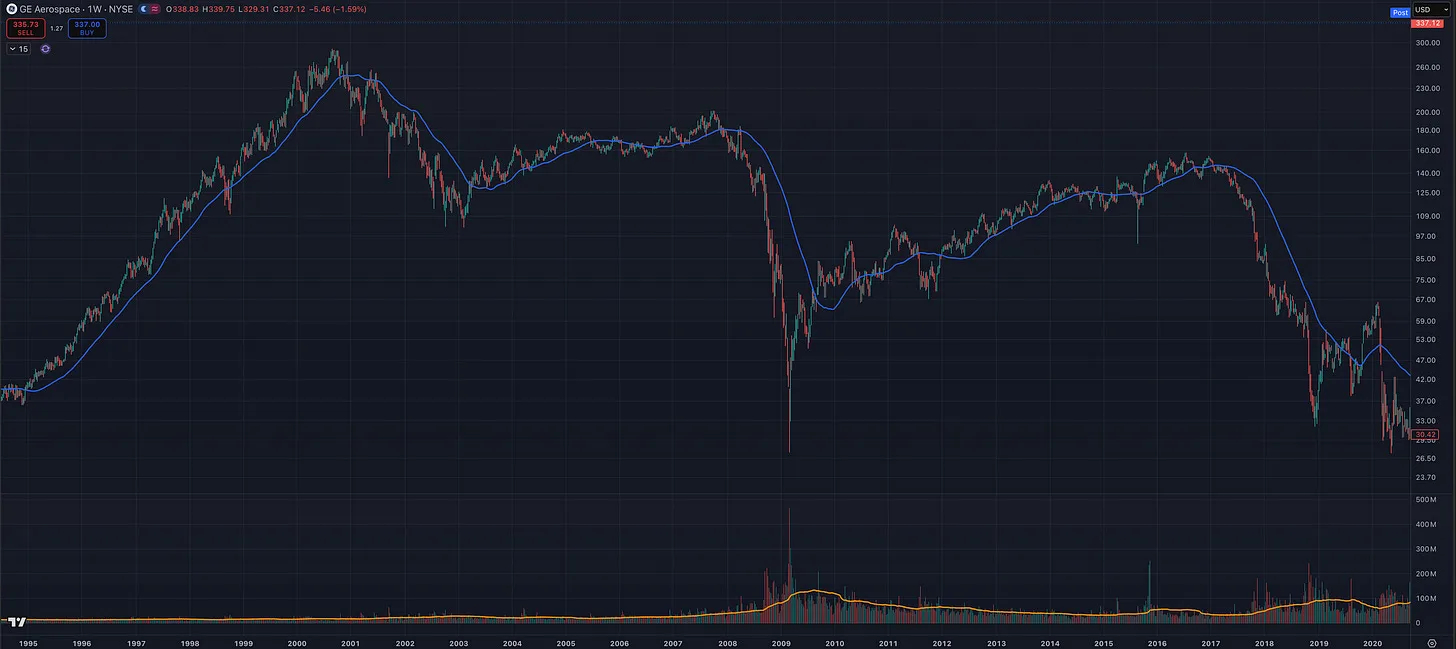
A trader buys a qualified breakout with a defined exit. The setup fails, but instead of selling, the trader decides the company still has a promising future. As the stock falls further, the trader adds because the shares now look cheaper.
The trade began as a momentum trade based on strength and controlled risk. Once the exit was ignored and the reason for holding changed, it became a different strategy.
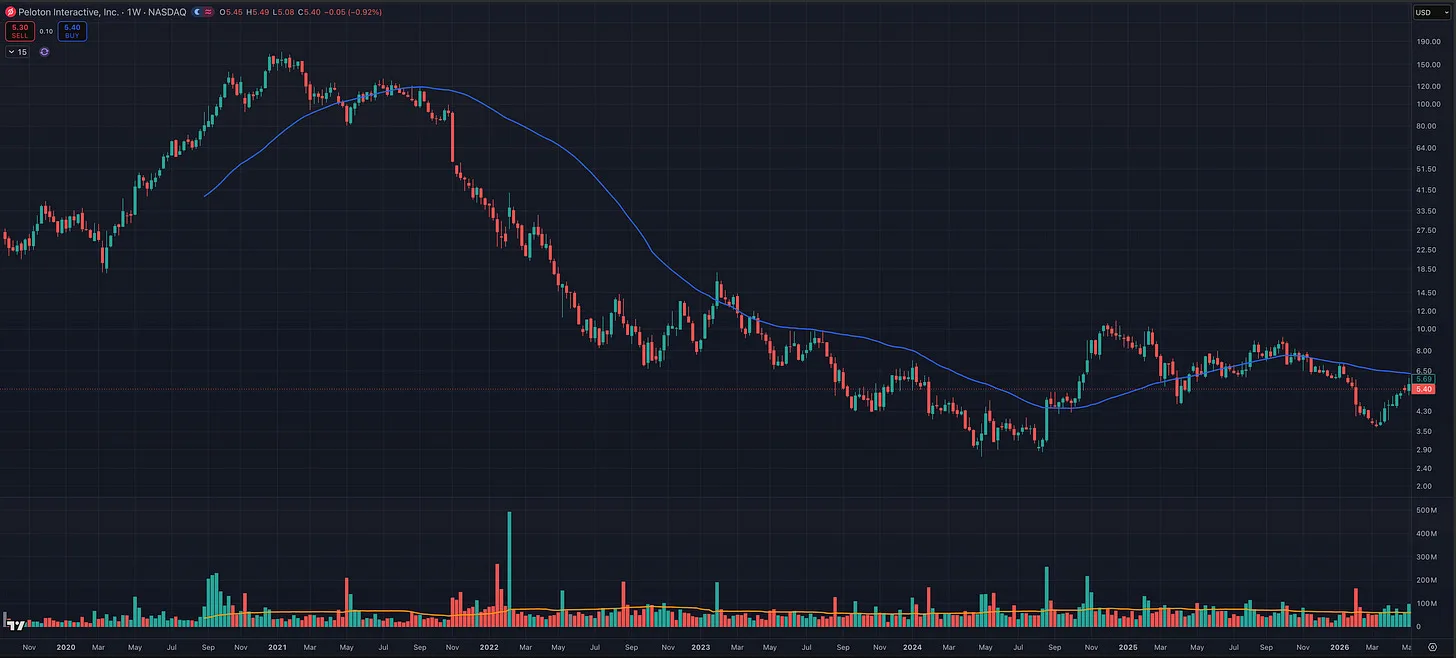
Peloton demonstrates why a former growth leader should not be treated as a permanent investment. Once the uptrend failed, the stock entered a prolonged Stage 4 decline beneath a falling 50-week moving average.
O’Neil’s loss-cutting discipline and Minervini’s warning about the “cheap trap” address this exact mistake. A lower price is not automatically a better opportunity. It can be evidence that the original premise has failed.
A separate long-term investment strategy can be perfectly valid, but it should be defined beforehand, managed by its own rules, and tracked separately. It should not be invented after a momentum trade violates its exit simply to avoid realizing a loss.
Before entering, I should know what qualifies the stock, what triggers the purchase, what invalidates the trade, and how I will manage a winner. If the trade is invalidated, I exit. I can always buy the stock again after it rebuilds and proves itself in a new Stage 2 uptrend.
Never allow a failed momentum trade to quietly become a long-term investment.
Watch: 100+ Years of Winning Stock Charts, Decade by Decade
LEARN MORE
We explore these concepts in greater depth in the Momentum Trading Strategy Course videos, included with All-Access.
Start with Module 1 here:
 Momentum Trading Strategy: The 100-Year Playbook Behind the Biggest Winning StocksMost people approach the stock market backwards.Mar 5, 2026 · Read on Substack →
More in Other Articles
All Other Articles articles →
Jun 23, 2026 · Other Articles
If I Had to Bet on a Group of Traders, I’d Bet on These Ones
The real edge after you learn the rules is becoming the kind of person who can actually follow them.
- Investing
- Trading

Jun 4, 2026 · Other Articles
Why It Hurts More to Spend Money You Earn Yourself
I thought making more money would make spending easier. Instead, trading and building businesses made every dollar feel harder to let go.
- Investing
- CANSLIM
- Trading
- Business
- Stock Market
- growth stock investing
May 8, 2026 · Other Articles
The $20 Books Taught Me the Rules. The $5,000 Course Bought Me Time
Why the right trading education is not a shortcut around the work, but it can compress years of confusion, mistakes, and unnecessary pain.
- Momentum Trading
- learn to trade
- Learn Trading
- Investing
- CANSLIM
- Trading
- position trading
- Momentum Trading Strategy